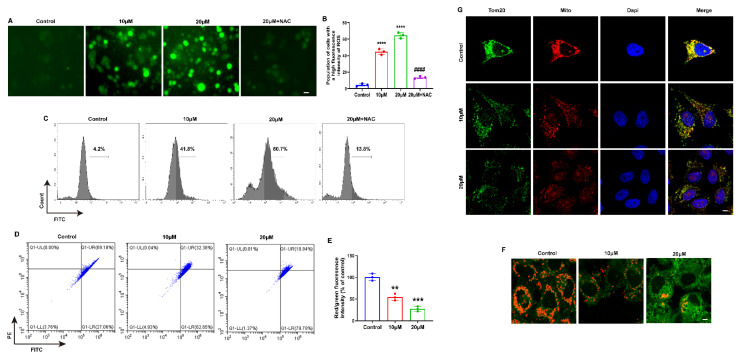
Figure 2.
MLD Decreased the Mitochondrial Membrane Potential, Inducing ROS Production in HepG2 Cells. (A) DCFH-DA fluorescent probe detected showed that MLD significantly promoted ROS production after 24 h treatment in HepG2 cells. Scale bar: 75 μm. (B) Quantitative analysis of ROS production. (C) ROS production measured by flow cytometry. (D) The JC-1 fluorescence intensity was measured by flow cytometry. (E) Statistical results of the ratio of red and green fluorescence in HepG2 cells treated with MLD for 24 h. (F) Fluorescence photographs of mitochondrial membrane potential in HepG2 cells. Scale bar: 25 μm. (G) Fluorescence photographs of mitochondrial membrane protein TOM20 in HepG2 cells. Scale bar: 25 μm. The results are representative of three independent experiments and are expressed as the mean ± SD. ** p < 0.01, *** p < 0.001, and **** p < 0.0001 compared with the control group. #### p < 0.0001 compared with MLD (20 μM) group.

