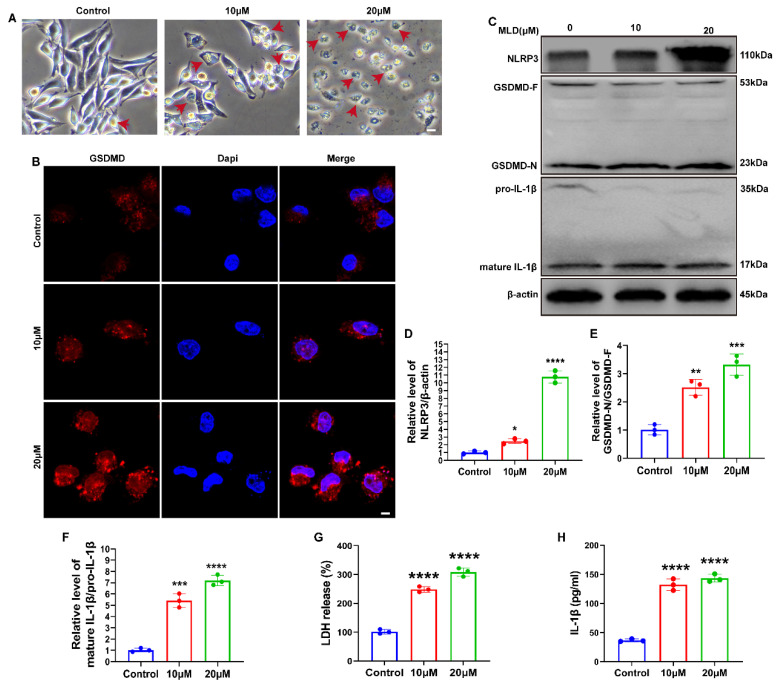
Figure 4.
MLD promoted HepG2 cell death via activating GSDMD-mediated pyroptosis. (A) The morphological changes of HepG2 cells treated with MLD. Scale bar: 100 μm. Arrow: the pyroptosis cells. (B) The protein level of GSDMD was detected by immunofluorescence. Scale bars: 50 μm. (C) The protein levels of the NLRP3, GSDMD, and IL-1β in the different groups were analyzed by Western blotting. The quantitative analysis of NLRP3/β-actin (D), GSDMD-N/GSDMD-F (E), and mature IL-1β/pro-IL-1β (F). The levels of the LDH (G) and IL-1β (H) in the different groups were analyzed by ELISA. The results are representative of three independent experiments and are expressed as the mean ± SD. * p < 0.05, ** p < 0.01, *** p < 0.001, and **** p < 0.0001 compared with the control group.

