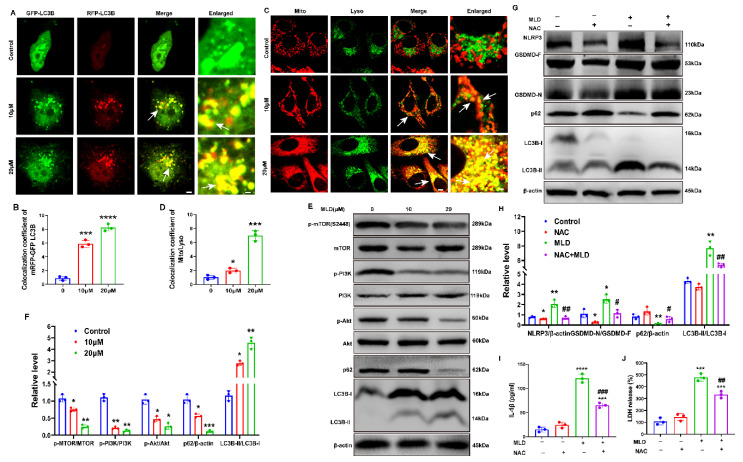
Figure 5.
MLD induced HepG2 cell mitophagy by inhibiting PI3K/AKT/mTOR pathway. (A) Confocal detection of HepG2 cells transfected with mRFP-GFP-LC3B plasmid. Scale bar: 25 μm and 5 μm in merge and enlarged, respectively. Arrow: the colocalization of GFP-LC3B and RFP-LC3B. (B) Colocalization area statistics in A. (C) Mito staining and Lyso staining were used to analyze the fusion of mitochondria and lysosomes in HepG2 cells treated with MLD for 24 h. Scale bar: 25 μm and 5 μm in merge and enlarged, respectively. Arrow: the colocalization of mitochondria and lysosome. (D) Colocalization area statistics in C. (E) Levels of the PI3K, p-PI3K, AKT, p-AKT, mTOR, p-mTOR, P62, and LC3B proteins in the different groups were analyzed by Western blotting. (F) The quantitative analysis of relative protein levels of E. (G) Levels of the NLRP3, GSDMD, p62, and LC3B after treatment with MLD (20 μM) in the presence or absence of NAC (5 mM) for 24 h were measured by Western blotting. (H) The quantitative analysis of relative protein levels of G. The levels of IL-1β (I) and LDH (J) after treatment with MLD (20 μM) in the presence or absence of NAC (5 mM) for 24 h were measured by ELISA. The results are representative of three independent experiments and are expressed as the mean ± SD. * p < 0.05, ** p < 0.01, *** p < 0.001, and **** p < 0.0001 compared with the control group. # p < 0.05, ## p < 0.01, and ### p < 0.001 compared with MLD-treated group.

