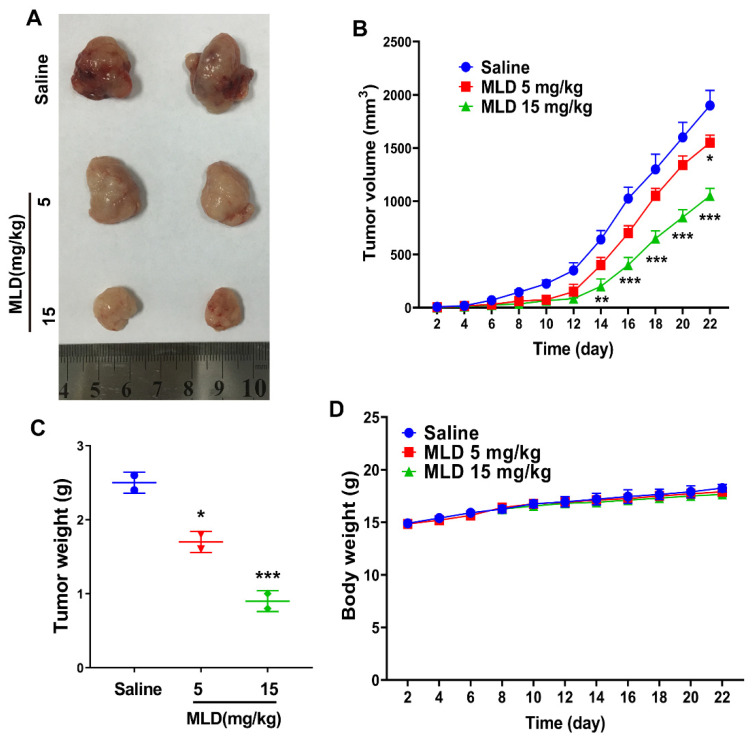
Figure 6.
MLD inhibited the HepG2 cell xenograft tumor growth in vivo. (A) The photography of tumor tissues. (B) The tumor growth curve. (C) The statistics of tumor weight. (D) The body weight change curve of mice. The results are representative of three independent experiments and are expressed as the mean ± SD. * p < 0.05, ** p < 0.01, and *** p < 0.001 compared with the saline group.

