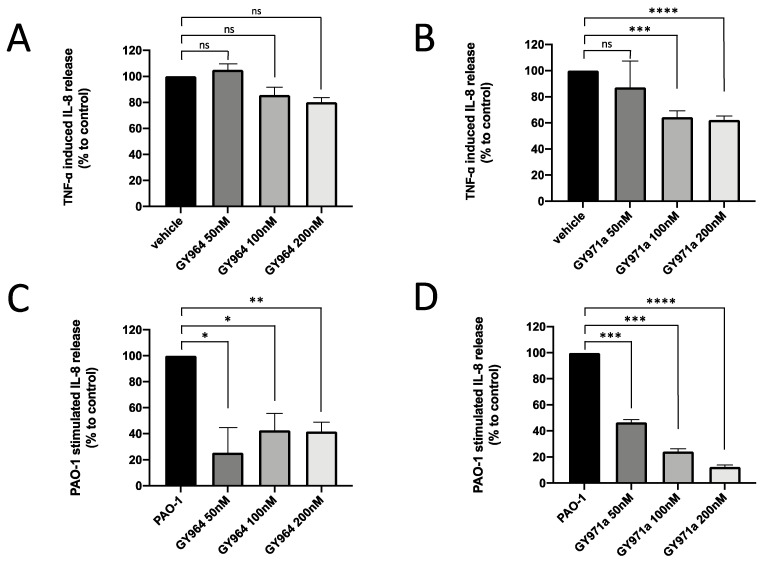
Figure 6.
IL-8 release (% to control) in IB3-1 cells treated with different concentrations of GY964 (4-PhDMA) (A,C) and GY971a (pANDMA) (B,D) with respect to TNF-α-stimulated (A,B) or PAO1-infected (C,D) IB3-1 cells. Statistics were performed by ANOVA, using Graph Pad Prism 9.0, where statistical significance at the levels of p < 0.05 (*) p < 0.01 (**), p < 0.005 (***), p < 0.0001 (****) is reported, together with non-significance (ns).

