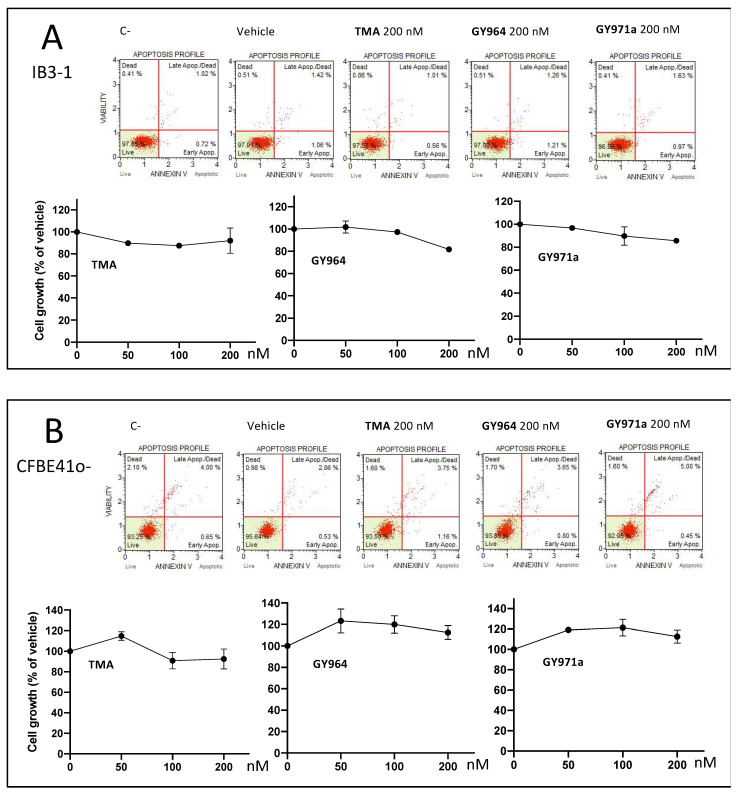
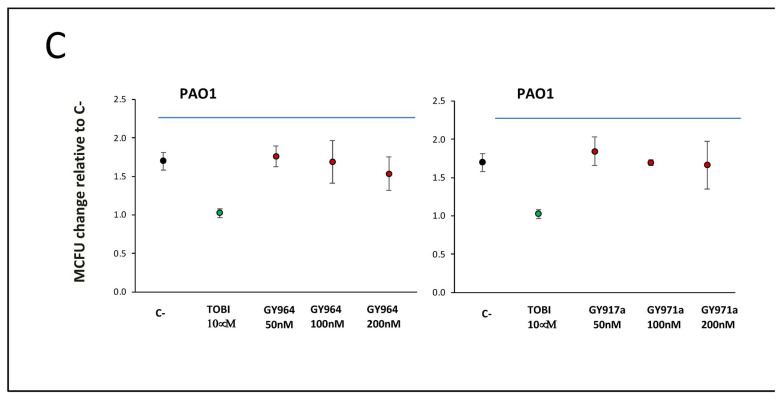
Figure 7.
Representative data (apoptosis and cell growth) obtained from the treated IB3-1 (Panel A) and CFBE41o- (Panel B) cells: Muse Analyzer plots and cell count recorded 48 h after the treatment with 50, 100, 200 nM TMA, GY964 (4-PhDMA) and GY971a (pANDMA). Antibacterial activity of GY964 (4-PhDMA) and GY971a (pANDMA) (Panel C) against Pseudomonas aeruginosa (PAO1 strain) after 6 h of incubation (red dots), compared to the untreated strain (black dot) and the strain treated with Tobramycin 10 μM (TOBI) (green dot). C-: untreated cells; vehicle: DMSO.


