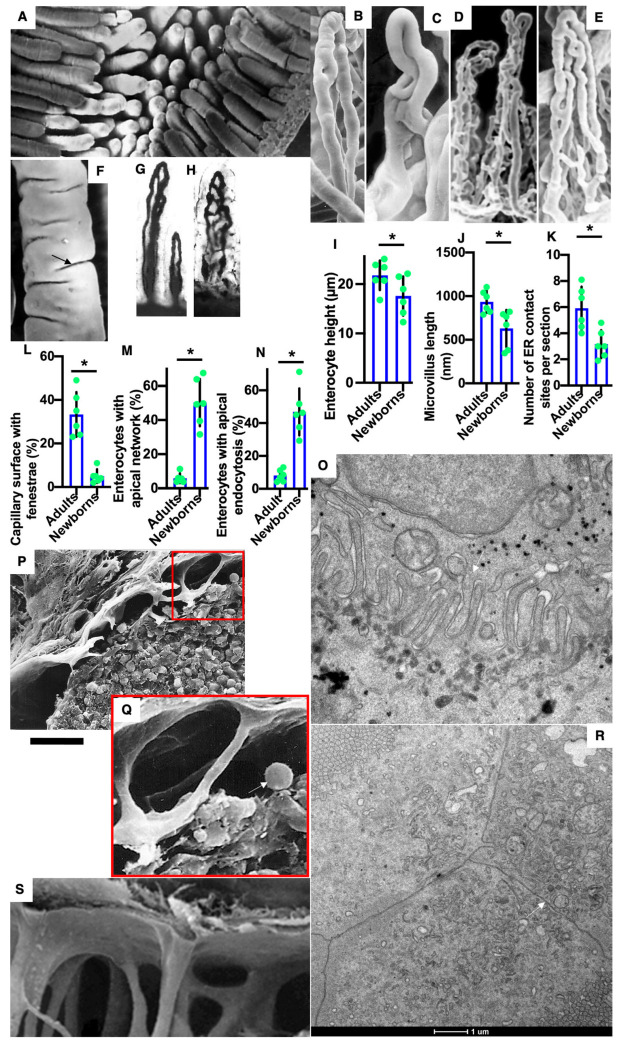
Figure 1.
Structure of enterocytes, vascular beds and lymph nodes in newborn rats before their feeding. (A,F) Scanning electron microscopy of the luminal surface of intestinal villi. (B–H) The structure of the vascular bed of the intestinal villi of newborn rats before their feeding. (B–E) Corrosion casts of blood microvessels in intestinal villus of newborn rats. (G,H) Total preparations of intestinal villi after staining for horseradish peroxidase. Blood capillaries contain black precipitate of DAB-HRP reaction in their lumen. (I–N) Graphs describing quantitative data of enterocytes. The percentage of enterocytes with a pronounced subapical network is higher in newborn rats. (O) Large interdigital contact (arrow) between two enterocytes in newborn rat before its feeding. (P,Q,S) Scanning EM of the subcapsular sinus of lymph node shows that before the first feeding of newborn rats, this sinus is almost empty and contained lower number of macrophages (arrow). This marker (gold dots) is visible at the trans side of Golgi stacks. (R) Simple contacts (arrow) between enterocytes without IDCs. *with the horizontal line below indicates that these two bars are different (p<0.05). Scale bars: 200 µm (A); 80 µm (B–E); 25 µm (F); 103 µm (G,H); 15 µm (P); 270 nm (O); 5 µm (Q). In (R), the scale bar is equal to 1 µm (indicated below it).

