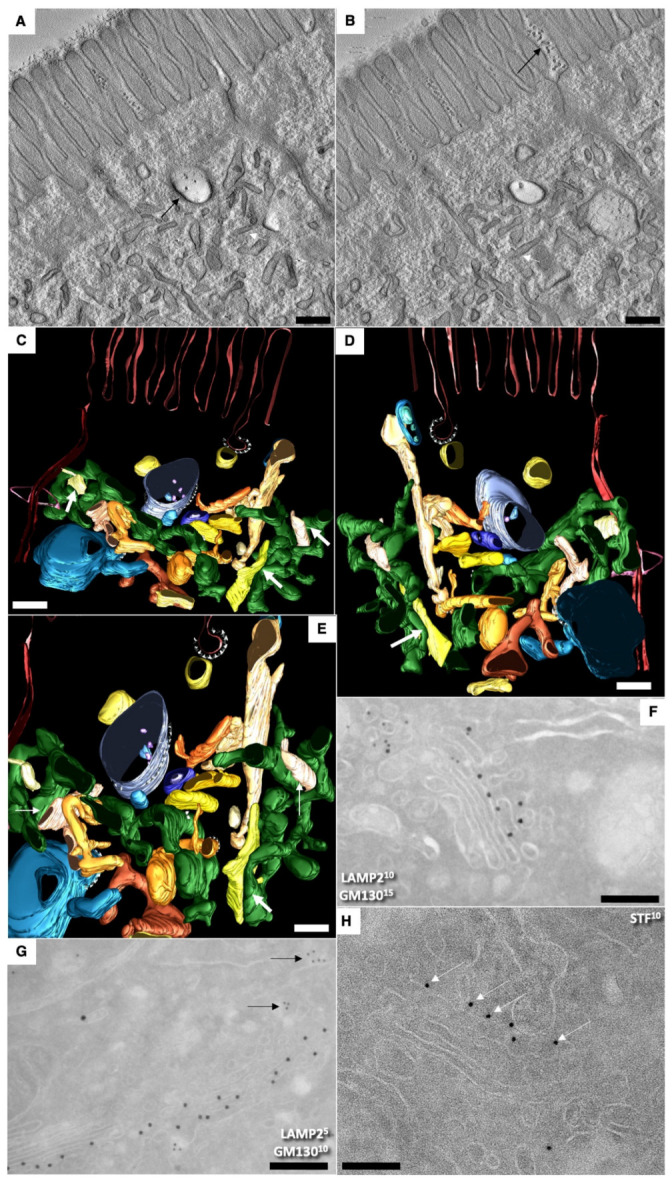
Figure 2.

Structure of enterocytes in newborn rats before their first feeding. (A–F) Subapical membranous tubular network (white arrows). Black arrows indicate membrane remnants between microvilli and inside endosome (A). (A,B) Serial tomographic images. (C–F) A three-dimensional model obtained on the basis of EM tomography. View from different angles (F). The enlarged area of the image enclosed inside the red box in (D). ER is colored green. Rough ER is large vacuoles and cisterns. Smooth ER is tubes. Endosomal structures are yellow. The purple color indicates APM. The BLPM is indicated in red. Multivesicular corpuscles and late endosomes are indicated in blue. Endosomal–ER contact sites are shown with white arrows. Clathrin—purple triangles. The Golgi stacks were already polarized. The immune EM marking for GM130 is present on the side of the Golgi complex (see movie 1). (G,F) Labeling for LAMP2 and GM130 (G) in (G) and LAMP2 (10 nm ) and Golgin-97 (15 nm) on (F). (H) Immune EM labeling for sialyltransferase (STF) of the enterocytes Golgi stack. Scale bars: 270 nm (G); 210 nm (F); 230 nm (H). In (A–E), scale bars are equal to 250 nm. In (E), the scale bar is equal to 70 nm.
