Figure 3.

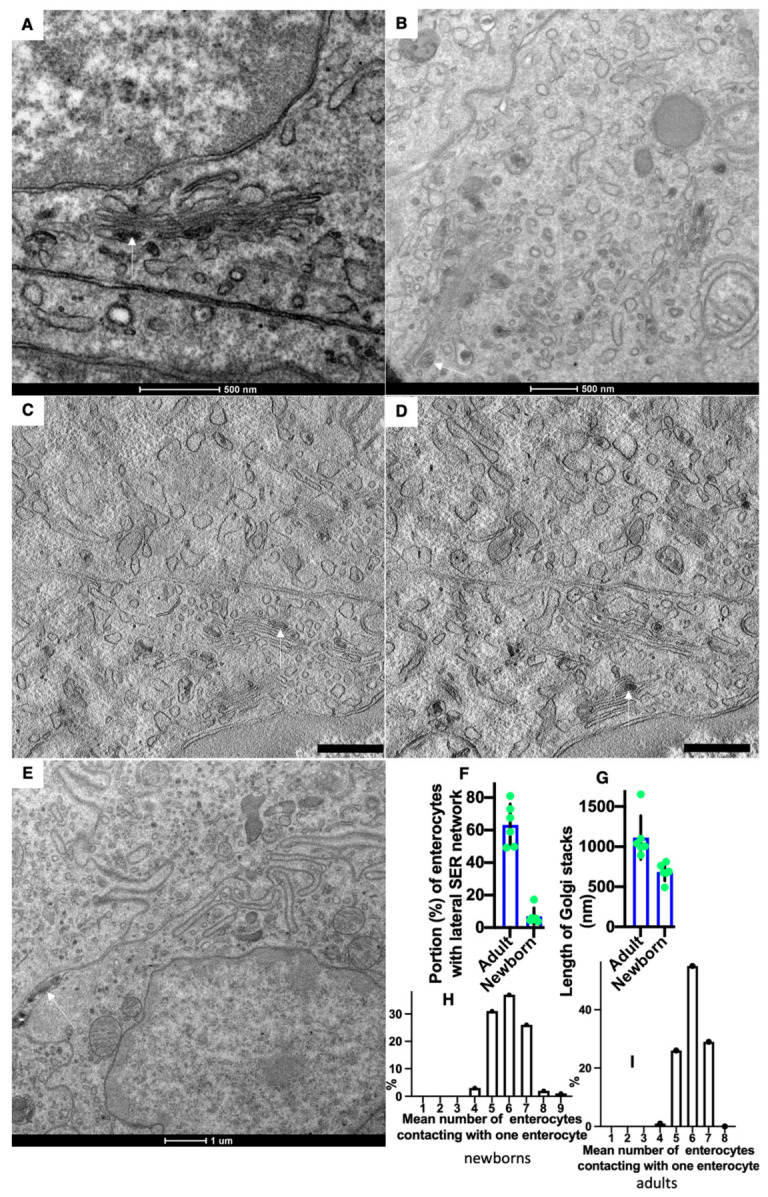
Structure of Golgi complex (GC) and vascular walls in newborn rats before their first feeding. (A,B) Routine Epon sections. (C,D) Serial tomographic slices. Multilamellar structures (arrows) are visible in the cisternal distension of the GCs. (E) Membrane remnants (white arrow) are visible inside the contact space between enterocytes. (F) The graph shows that in newborn rats, lower (p < 0.05) number of enterocytes exhibited lateral SER network. (G) The graph shows that in newborn rats, the length of Golgi stacks was lower (p < 0.05). (H,I) Graphs show the distribution of the mean number of neighbors of one enterocyte in newborn (H) and adult (I) rats. In the newborn rats, the shift of these distributions towards the low number is significant (p < 0.05). Scale bars: 465 nm (C,D). In (A,B,E), scale bars are indicated below each image.
