Figure 4.
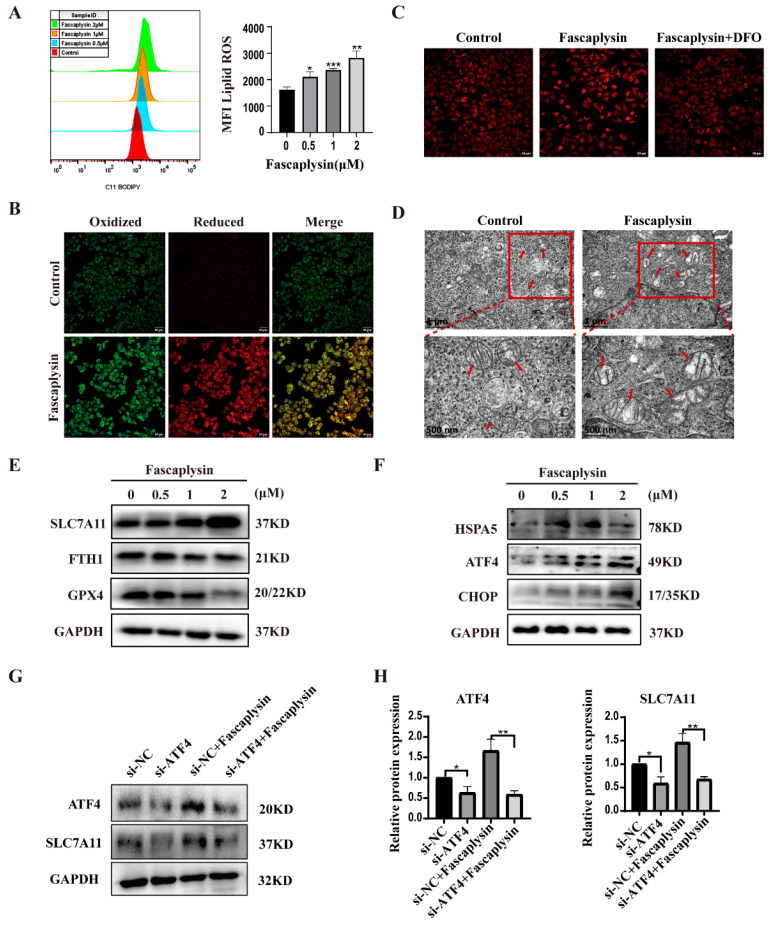
Fascaplysin induced ferroptosis and ER stress in A549 cells. (A) Representative images and statistical results of lipid ROS in A549 cells. (B) Fluorescence images of lipid peroxidation in A549 cells were observed using a C11-BODIPY-581/591 probe. (C) A549 cells were treated with fascaplysin (2 μM) and DFO (50 μM) for 3 h, and fluorescence images of cellular Fe2+ were detected using a Ferrorange probe. (D) Intracellular mitochondrial morphological changes in A549 cells were observed by transmission electron microscopy (TEM) (original magnification: 6000×, 80,000×). Red arrows indicate mitochondria (E) Ferroptosis-related proteins were detected by Western blotting. (F) ER stress-related proteins were detected by Western blotting. (G,H) A549 cells were transfected with si-ATF4 (20 nM) for 60 h and treated with fascaplysin for 3 h. ATF4 and SLC7A11 protein expression was then detected by Western blotting. Analysis results represent mean ± SD, * p < 0.05, ** p < 0.01, and *** p < 0.001.

