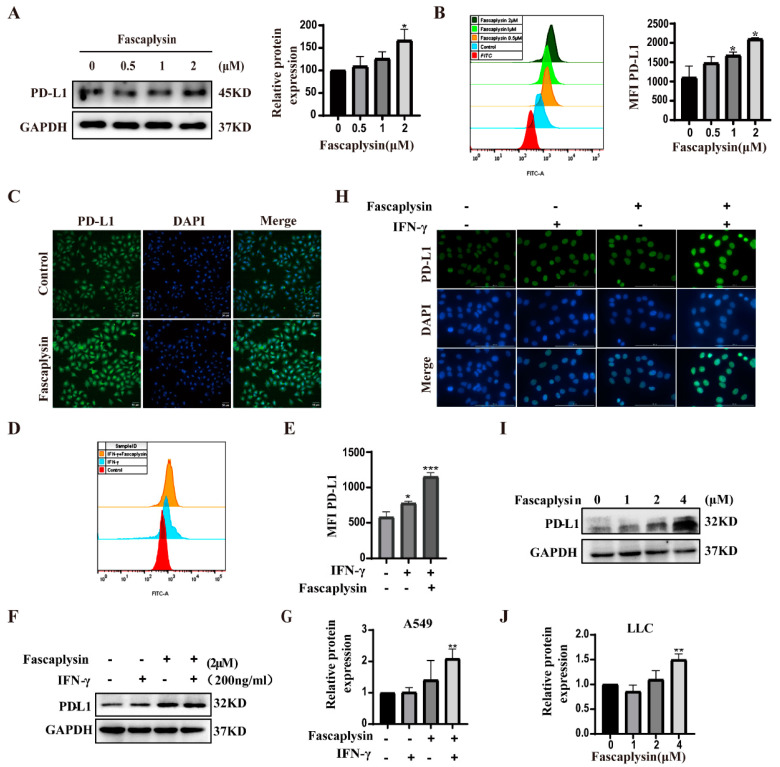
Figure 6.
Fascaplysin promoted PD-L1 expression in NSCLC cells. (A) PD-L1 protein expression was detected by Western blotting. (B) After treatment of A549 cells with the PD-L1 kit, the fluorescence intensity of PD-L1 was analyzed by flow cytometry. The histogram is a quantification of the fluorescence intensity of PD-L1. (C) Immunofluorescence showing the level of PD-L1 protein in A549 cells. (D,E) A549 cells were treated with IFN-γ (200 ng/mL) and fascaplysin (2 μM) for 3 h and PD-L1 fluorescence intensity was detected by flow cytometry using a PD-L1 kit. Histograms show quantitation of PD-L1 fluorescence intensity. (F,G) A549 cells were treated with fascaplysin and IFN-γ, alone or in combination, and PD-L1 expression was examined by Western blotting. (H) LLC cells treated with fascaplysin (4 μM) and IFN-γ (200 ng/mL), alone or in combination, were examined for PD-L1 expression by immunofluorescence. (I,J) LLC cells were treated with fascaplysin (0, 1, 2, 4 μM) at various concentrations for 3 h to detect PD-L1 expression by Western blotting. Analysis results represent mean ± SD, * p < 0.05, ** p < 0.01, *** p < 0.001.

