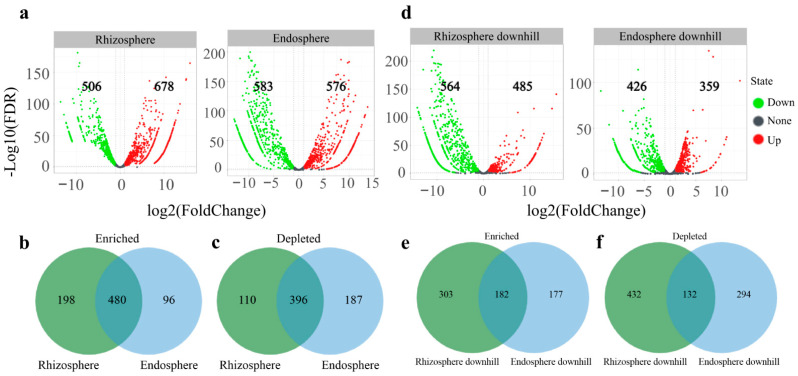
Figure 4.
The enriched and depleted OTUs in the root endosphere, rhizosphere, downhill endosphere, and downhill rhizosphere. (a) Bulk soil was used as the control for differential abundance analysis. Enriched and depleted OTUs of the rhizosphere and endosphere compared with the bulk soil. (b) The number of differentially enriched OTUs between the root endosphere and rhizosphere. (c) The number of differentially depleted OTUs between the endosphere and rhizosphere. (d) Uphill rhizosphere and the root endosphere were used as controls for differential abundance analysis. Enriched and depleted OTUs of the rhizosphere downhill and endosphere downhill compared with the uphill rhizosphere and the root endosphere. (e) The number of differentially enriched OTUs between the downhill rhizosphere and endosphere. (f) The number of differentially depleted OTUs between the downhill rhizosphere and endosphere. Each point represents an individual OTU; the position along the X-axis represents the abundance fold change compared with bulk soil, and the Y-axis represents the −log 10 (FDR) obtained by correcting the p-value of the significant difference. The closer the point to the top of the graph, the more significant the difference is.

