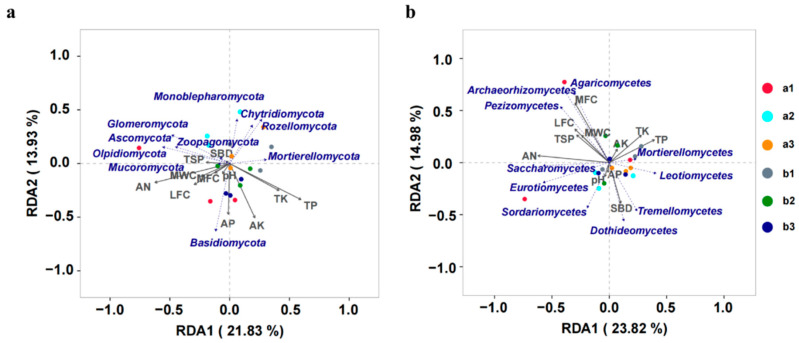
Figure 5.
Redundancy analysis (RDA) ordination plots demonstrate the relationship between soil physical and chemical properties and fungal communities at the (a) phylum and (b) class levels. The arrows indicate the length and angle between the explanatory and response variables and reflect their correlations. Different samples are marked in different colors. a1, a2, and a3 represent the bulk soil samples of the uphill plots, and b1, b2, and b3 represent the bulk soil samples of the downhill plots.

