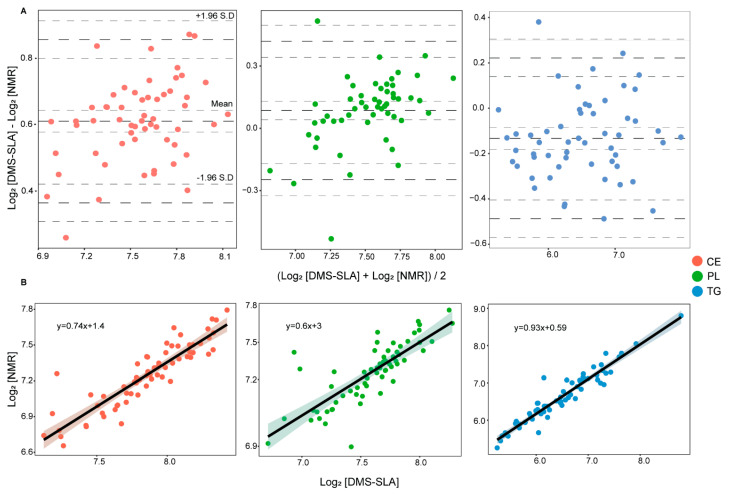
Figure 1.
(A) Bland–Altman analysis of CE, PL, and TG concentrations from subsequent NMR and DMS-SLA measurements on single sample aliquots. X-axis and Y-axis represent mean and difference of the two platforms, respectively. The bold dotted lines represent the mean difference and limits of agreement, the dotted lines represent confidence intervals. (B) Pearson’s correlation analysis of CE, PL, and TG concentrations measured with B.I.LISA and DMS-SLA.

