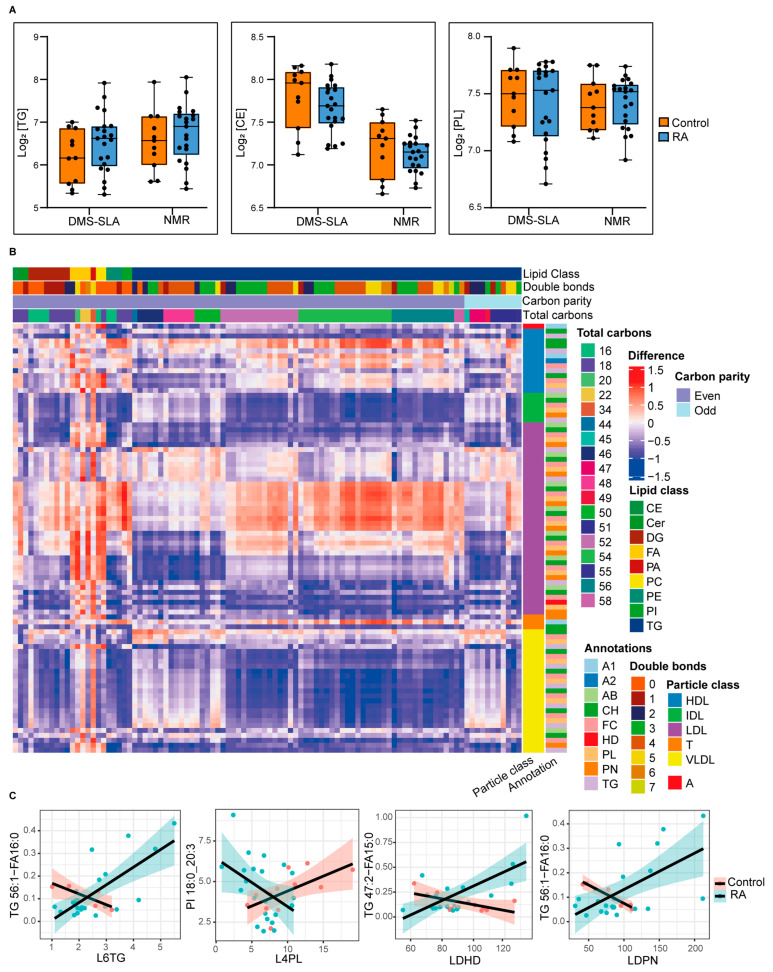
Figure 4.
(A) Comparison of TG, CE, and PL concentrations in plasma samples from healthy controls and RA patients. The median value is marked by a horizontal line inside the box. The whiskers extending from top and bottom of the box represent the largest and smallest values, respectively. (B,C) The correlation difference of lipid–lipoprotein pairs among healthy controls and RA patients.

