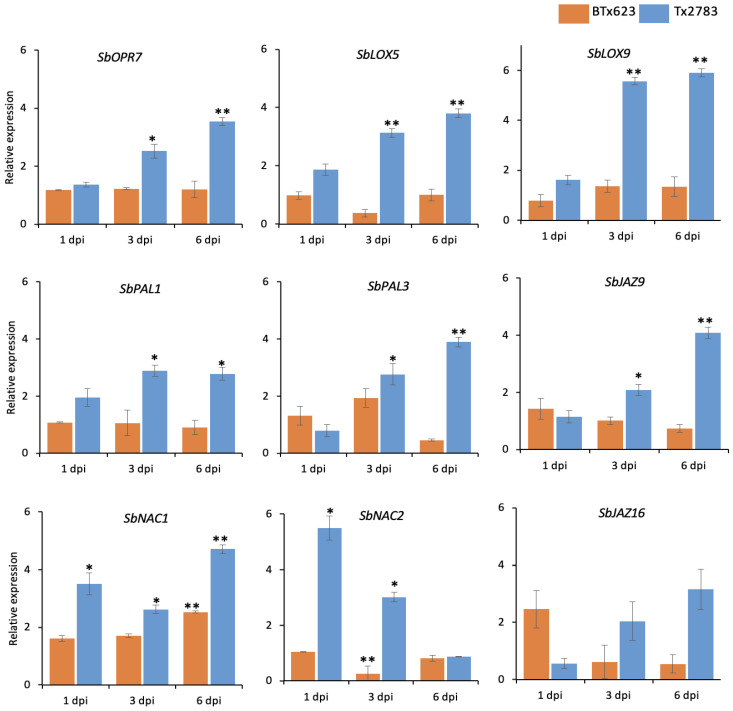
Figure 5.
Expression pattern of phytohormone-related genes in response to sugarcane aphid in resistant (Tx2783) and susceptible (BTx623) sorghum genotypes at 1-, 3-, and 6-days post infestation (dpi). qRT-PCR was used to determine the relative expression of each gene using the sorghum α-tubulin gene as a control. Error bars in each bar represent the ± standard error (n = 3) and asterisks indicate significant differences between the control and aphid treated samples, * p < 0.05, ** p < 0.01. The bars without asterisks are non-significant (p > 0.05).

