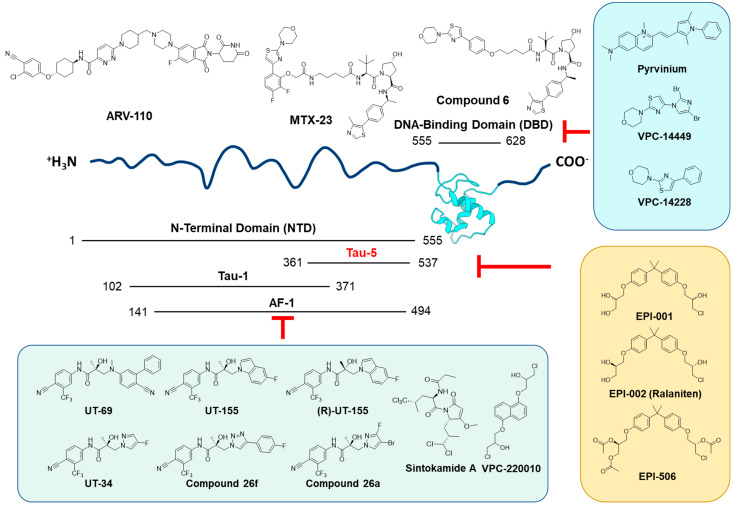
Figure 5.
Schematic illustration of androgen receptor splice variant from N-terminal domain to C-terminal. Compounds that inhibit the AF-1 region of NTD domain are listed in the lower left hand green highlighted frame, compounds that inhibit the Tau-5 region of the NTD are listed in the yellow highlighted frame, and compounds inhibiting the DBD are listed in the upper right blue highlighted frame. Two reported PROTAC molecules based on DBD inhibitors are shown on the top of the figure.

