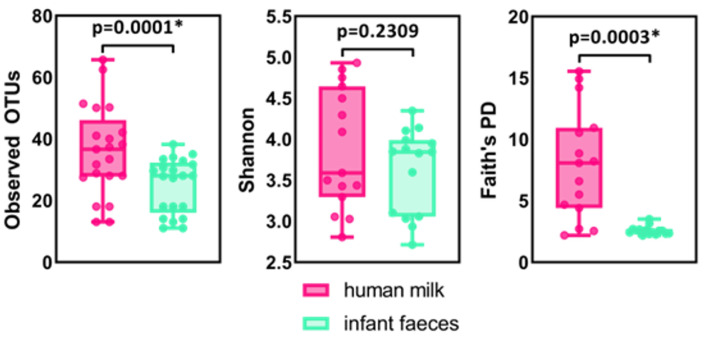
Figure 4.
α-diversity boxplots summarising bacterial diversity of human milk and infant faecal samples using Observed OTUs, Faith’s phylogenetic diversity (PD) and Shannon indices. Asterisks (*) indicate a significant difference (p < 0.01) in bacterial diversity between human milk and infant faecal samples. Statistical analysis was conducted using Two-Way ANOVA.

