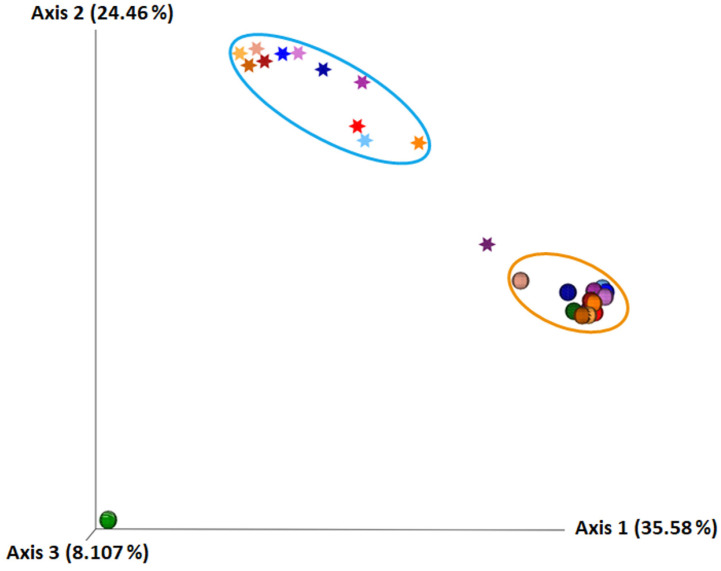
Figure 5.
PCoA analysis of β-diversity calculated with the Unweighted UniFrac metric. Human milk samples are represented by an asterisk and faecal samples by a circle. Samples from the same pair of mother and breastfed infant are marked with the same colour, with the samples with the lightest shading of each colour collected within one week after birth, with the medium shading one month after birth, and with the darkest shading one month after the introduction of solid food into the infant diet. The blue ellipse surrounds a cluster of human milk samples, whereas the orange ellipse surrounds a cluster of infant faecal samples.

