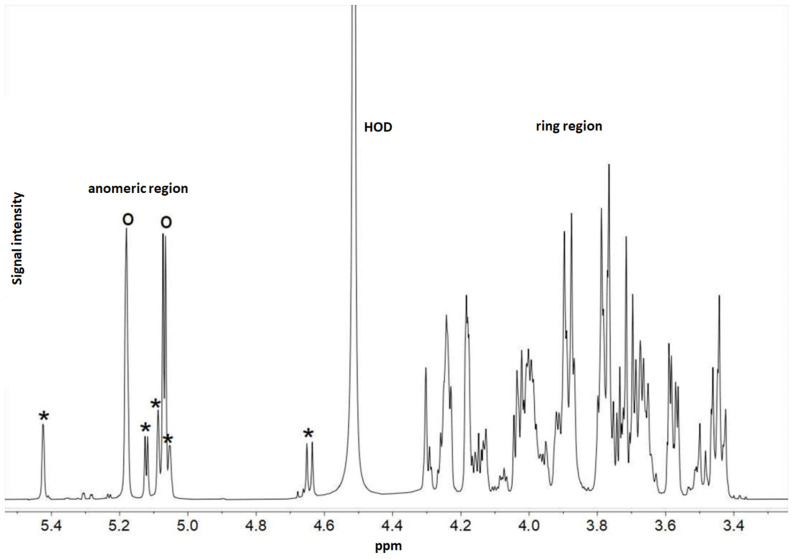
Figure 8.
1H NMR spectrum of MC1 EPS-b recorded in D2O at 500 MHz at 50 °C. Protons of the ring and anomeric regions are shown. Open circles (o) denote the two most intense anomeric resonances belonging to the main polysaccharide, while asterisks (*) indicate the five less intense anomeric peaks, indicating another polymer present in minor amounts.

