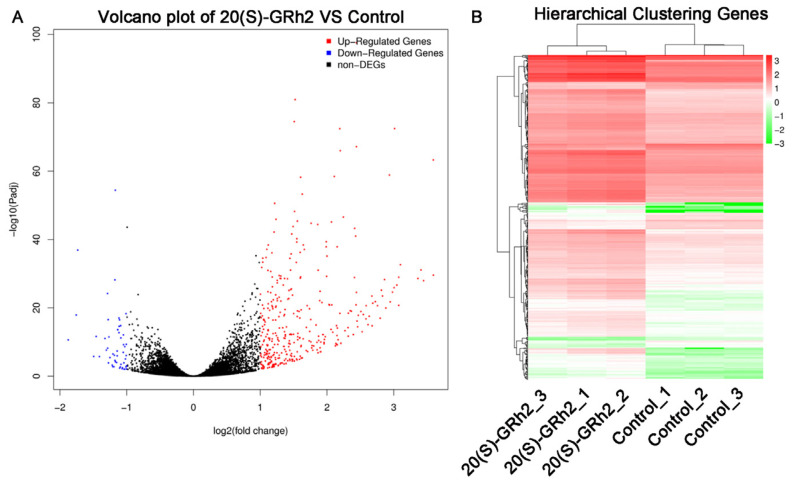
Figure 2.
Identification of DEGs in 20(S)-GRh2-treated HeLa cells. (A) Volcano plots of DEGs are displayed using |log 2(Fold Change)| > 1 and adjusted p-value < 0.05. Red and blue dots mark upregulated genes and downregulated genes, respectively. (B) Cluster heatmap of DEGs with |log 2(Fold Change)| > 1 and adjusted p-value < 0.05. Red, upregulated DEGs; green, downregulated DEGs; DEGs, differentially expressed genes; 20(S)-GRh2, 20(S)-ginsenoside Rh2.

