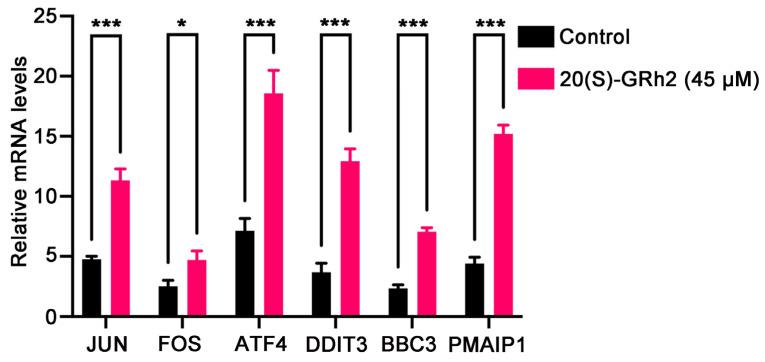
Figure 8.
Validation of selected DEGs by qPCR. The mRNA expression levels of the DEGs were quantified in control and 45 μM 20(S)-GRh2 groups by qPCR. GAPDH mRNA was used as loading control. Data presented as mean ± standard deviation of three independent experiments (two-tailed Student’s t-test). * p < 0.05; *** p < 0.001 vs. control. DEGs, differentially expressed genes; 20(S)-GRh2, 20(S)-ginsenoside Rh2.

