Figure 9.
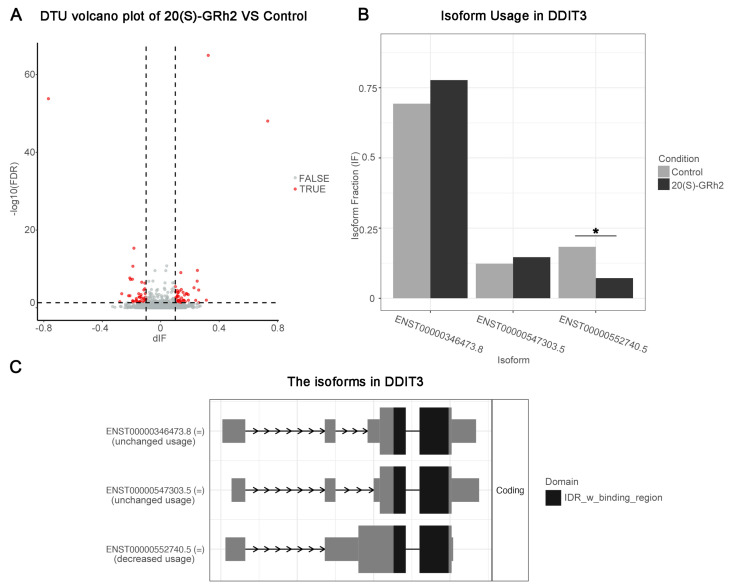
DTU analysis. (A) Volcano plots showing genes with DTU (red dots mark DTU; differential isoform fraction (dIF) > 0.05 and FDR < 0.05) in the control and G-Rh2-treated groups. (B) Quantitation of the isoform fraction in control and 20(S)-GRh2 treated groups. (C) Isoform landscape of all 3 isoforms of DDIT3 in 20(S)-GRh2 treatment group compared with control. * p < 0.05. 20(S)-GRh2, 20(S)-ginsenoside Rh2.

