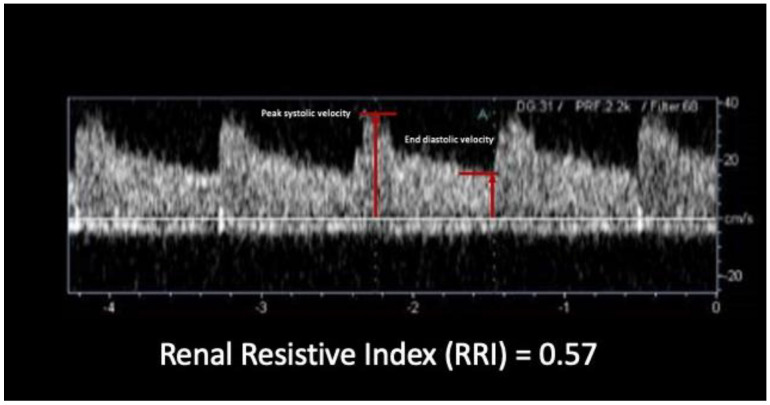
Figure 2.
RRI calculation in the Doppler analysis. The figure shows a typical low resistance Doppler spectrum in a renal interlobar artery. The markers highlighted are related to the maximum systolic peak and to the end-diastolic velocity which are used for the calculation of the RRI. Both markers are measured in the same cardiac cycle.

