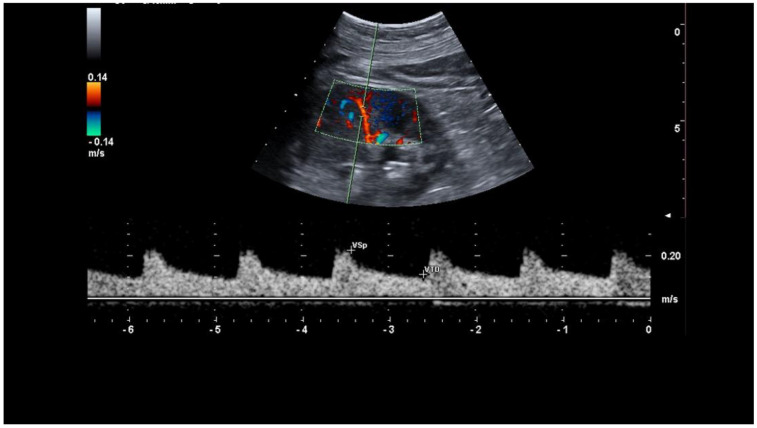
Figure 3.
RRIs in a middle interlobular artery. The figure shows the exact sampling point of the Doppler signal at the level of the interlobar artery of the kidney for the representation of the Doppler spectrum on which the RRI is calculated. To note the regularity of the cardiac cycle (sinus rhythm) which allows to have an accurate measurement of the RRI and the sampling of the peak systolic and end diastole velocity in the same cardiac cycle.

