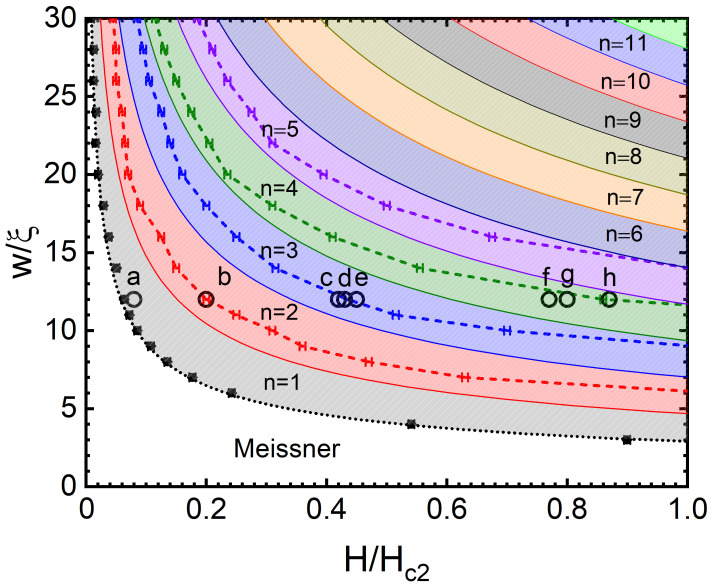
Figure 2.
Equilibrium vortex row phase diagram that plots the SN’s width (in units of ) as a function of the intensity of the applied magnetic field (in units of for different numbers of formed vortex rows (n). The simulations were performed using the SGL approach with periodic boundary conditions along the length, with a unit cell length of . The dashed lines denote the threshold for the formation of an additional vortex row (shown here up to ). The coloured regions represent the approximated regions for , which are delimited by solid lines given by the expression = . The circles, which are labelled a–h, relate to the vortex configurations shown in Figure 3. The black dotted line corresponds to the analytical expression [44], with [45].

