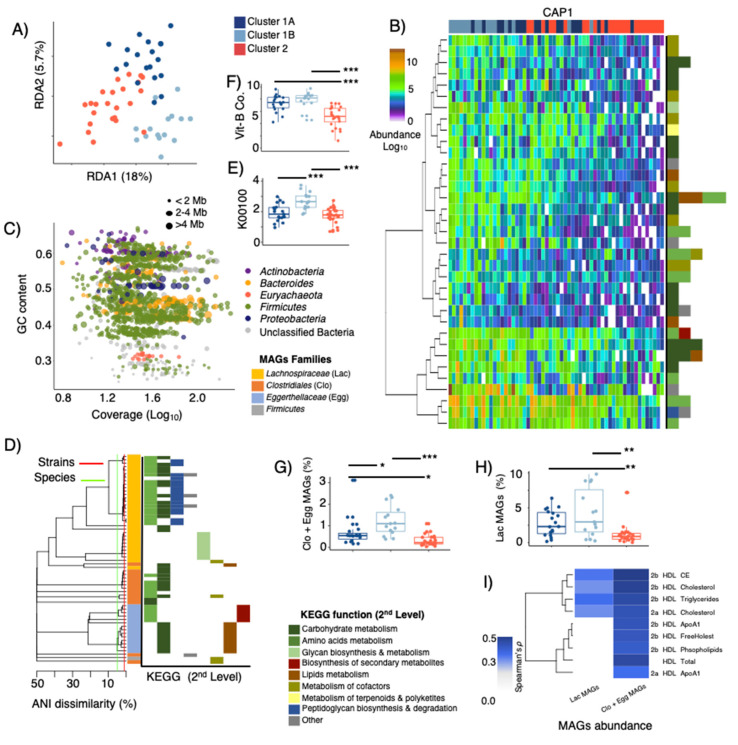
Figure 5.
(A) RDA displaying discrimination of LPD clusters based on selected KOs obtained from shotgun metagenome and assembly (p = 0.001, explained variance = 23.7%). (B) Overview of most discriminatory (based on CAP1 and CAP2 within db-RDA) KOs with known metabolic functions clustered using Canberra distances and general agglomerative hierarchical clustering procedure based on ward2. (C) GC-content–Coverage plot of metagenome assembled genomes (MAGs) with ≤10% contamination and ≥70% completeness. MAGs are colored according to phylum-level taxonomic affiliation and bubble size indicates their genome size in mega-bases (Mb). (D) Phylogeny of MAGs containing KOs that discriminate LPD clusters (1A, 1B and 2), a cut-off of 95-ANI (species-level) and 99-ANI (strain-level) are denoted. MAGs are colored at family level affiliations and their KOs contribution at the 2nd level KEGG function pathways are provided. (E) Relative abundance of protein-encoding genes associated with butanol dehydrogenase (K00100), and (F) protein-encoding genes associated metabolism and biosynthesis of vitamin B1, B2, B5 and B9. (G,H) Cumulative abundance (RPKM) of MAGs affiliated to Clostridiales (Clo), Eggerthellaceae (Egg), and Lachnospiraceae (Lac) among LPD clusters. (I) Heatmaps displaying significant (False Discovery Rate corrected, FDR ≤ 0.05) Spearman’s rank correlations between MAGs abundance and HDL subfractions. Stars show statistical level of significance (* p ≤ 0.05, ** p ≤ 0.01, *** p ≤ 0.001).

