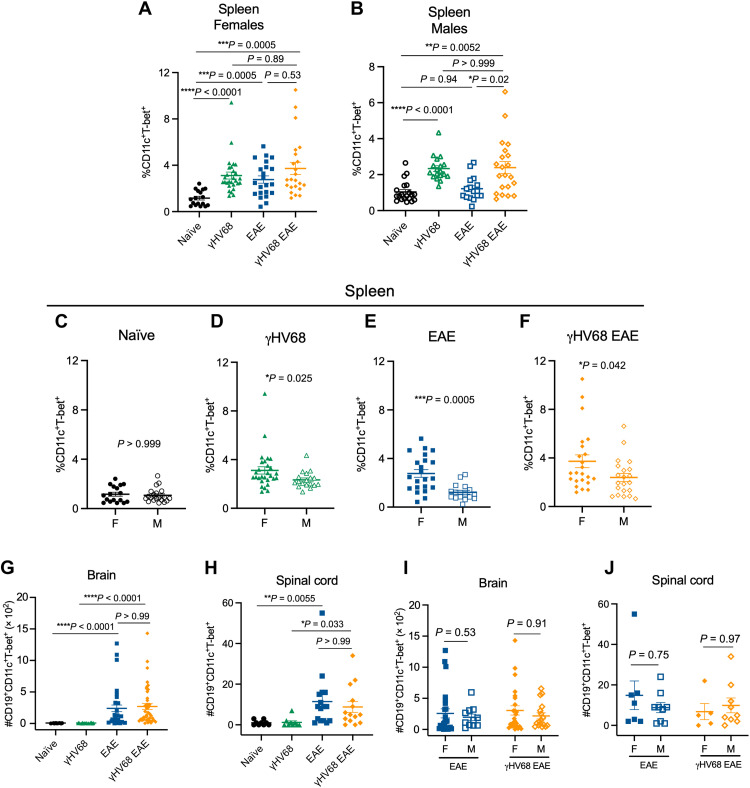
Fig. 1. ABCs are expanded in a sex-biased manner during γHV68 infection and EAE.
C57BL/6(J) mice were infected with γHV68 for 35 days to establish latency (γHV68, green triangles) or mock-infected with blank medium (naïve, black circles). In some mice, MOG35–55 EAE was induced 35 days after mock infection (EAE, blue squares) or initial virus infection (γHV68 EAE, orange diamonds). At 35 days post-infection (p.i.) or 13 days after EAE induction, spleens, brains, and spinal cords were collected and processed for flow cytometry. (A and B) Proportion of ABCs (CD11c+T-bet+) of previously activated B cells (CD19+IgD−) in the spleen of females (filled symbols) and males (open symbols). (C to F) Proportion of ABCs (CD11c+T-bet+) of previously activated B cells (CD19+IgD−) in the spleen of females (F) and males (M). Data are repeated from (A) and (B) in (C) to (F) for better visualization and comparison of sex differences. (G and H) Number of ABCs in the brain (G) and spinal cord (H), data from both male and female mice. (I and J) Number of ABCs in the brain (I) and spinal cord (J) of induced mice, separated by males (M) and females (F). Data repeated from (G) and (H) with sex are indicated. (A to F) Data pooled across nine experiments; n = 16 to 29 mice per group. (G to J) Data pooled across five experiments; n = 9 to 41 mice per group. Data are presented as means ± SEM, analyzed by one-way analysis of variance (ANOVA; A and B), Mann-Whitney (C to F, I, and J), or Kruskal-Wallis (G and H) test; ****P < 0.0001, ***P < 0.001, **P < 0.01, and *P < 0.05.

