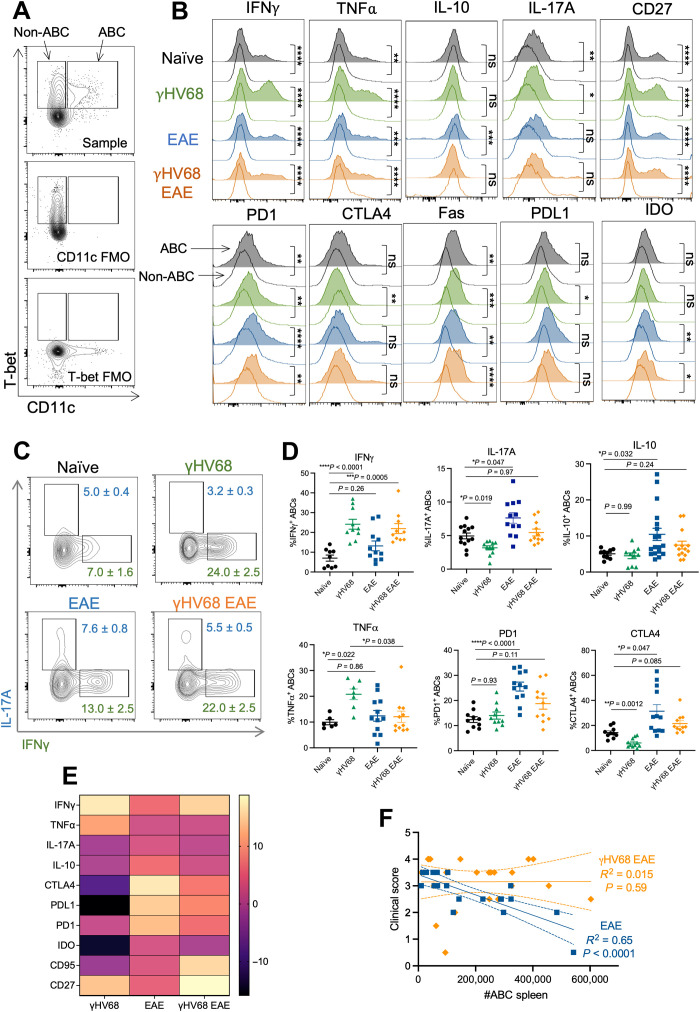
Fig. 2. γHV68 infection and EAE drive differential ABC phenotypes.
Female C57BL/6(J) mice were mock-infected (naïve, black circles) or infected with γHV68 for 35 days (γHV68, green triangles). In some mice, MOG35–55 EAE was induced 35 days after mock infection (EAE, blue squares) or γHV68 infection (γHV68 EAE, orange diamonds). At 35 days p.i. or 13 days after EAE induction, spleens were collected and processed for flow cytometry. (A) Flow plots of ABCs (CD19+CD11c+T-bet+) and non-ABCs (CD19+CD11c−T-bet+), previously gated on CD19+IgD− live lymphocytes in the spleen. Representative sample alongside fluorescence-minus one (FMO) controls that lack either CD11c or T-bet staining. (B) Histogram plots of representative samples, previously gated on CD19+CD11c+T-bet+ ABCs (area filled lines) or CD19+CD11c−T-bet+ non-ABCs (empty lines) in the spleen, showing the modal expression of various markers. (C) Representative flow plots of expression of IFNγ and IL-17A on CD19+CD11c+T-bet+ ABCs in the spleen. Files were concatenated from samples from the same treatment group. (D) Percent of splenic ABCs (CD19+CD11c+T-bet+) that are positive for IFNγ, IL-17A, IL-10, TNFα, PD1, and CTLA4. (E) Heatmap representing changes in the frequency of the ABC population expressing given markers compared relative to naïve controls. (F) Linear regression of clinical scores versus number of splenic ABCs. Data are pooled across two to three experiments; n = 9 to 18 mice per group. Data are presented as means ± SD (C) or SEM (D), analyzed by Mann-Whitney test (B), one-way ANOVA with multiple comparisons (D), and simple linear regression with slope and 95% confidence interval plotted (F); ****P < 0.0001, ***P < 0.001, **P < 0.01, and *P < 0.05.

