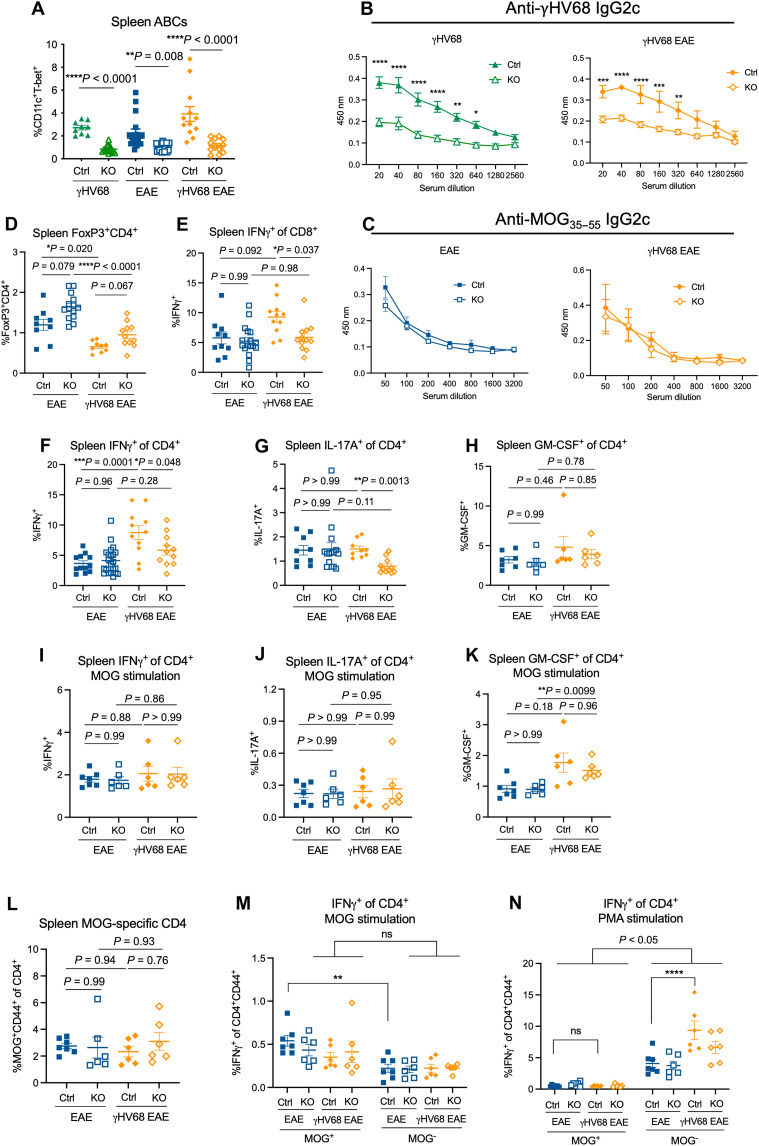
Fig. 3. ABC KO mice demonstrate different functional capacities during EAE and γHV68 infection.
Female Tbx21fl/flCd19cre/+ (KO, open symbols) and Tbx21fl/flCd19+/+ (Ctrl, filled symbols) mice were infected with γHV68 or mock-infected for 35 days and then induced for MOG35–55 EAE. At days 13 to 18 after EAE induction, blood, spleens, brains, and spinal cords were collected. Spleens, brains, and spinal cords were processed for flow cytometry, and serum was collected from blood. (A) Percent ABCs (CD11c+T-bet+) of previously activated B cells (CD19+IgD−) in the spleen of Ctrl and KO mice (n = 3 to 7 per group). (B and C) Optical density (y axis) reflecting titers (x axis; dilution of serum) of anti-MOG35–55 (B) or anti-γHV68 (C) IgG2c antibodies in Ctrl and KO mice, separated by EAE and γHV68 EAE mice; n = 3 to 6 mice per group. (D) Percent of live cells in the spleen that are CD4+FoxP3+. (E to H) Splenocytes from Ctrl and KO mice stimulated with PMA/ionomycin. Percent IFNγ+ of CD3+CD8+ (E) and CD3+CD4+ (F), and percent CD4+ T cells expressing IL-17A (G) and GM-CSF (H) are reported. (I to K) Splenocytes from Ctrl and KO mice stimulated with MOG35–55 peptide. Percent CD4+ T cells expressing IFNγ (I), IL-17A (J), or GM-CSF (K) following MOG stimulation. (L) Proportion of CD44+ MOG-specific CD4+ T cells in the spleen of Ctrl and KO mice. (M and N) Splenocytes from Ctrl and KO mice stimulated with MOG peptide (M) or PMA (N) and the proportion of CD4+CD44+MOG+ or CD4+CD44+MOG− cells expressing IFNγ. Data are presented as means ± SEM. Analyzed by Mann-Whitney test (A), two-way ANOVA (B, C, M, and N), or one-way ANOVA with multiple comparisons (D to L); ****P < 0.0001, ***P < 0.001, **P < 0.01, and *P < 0.05.

