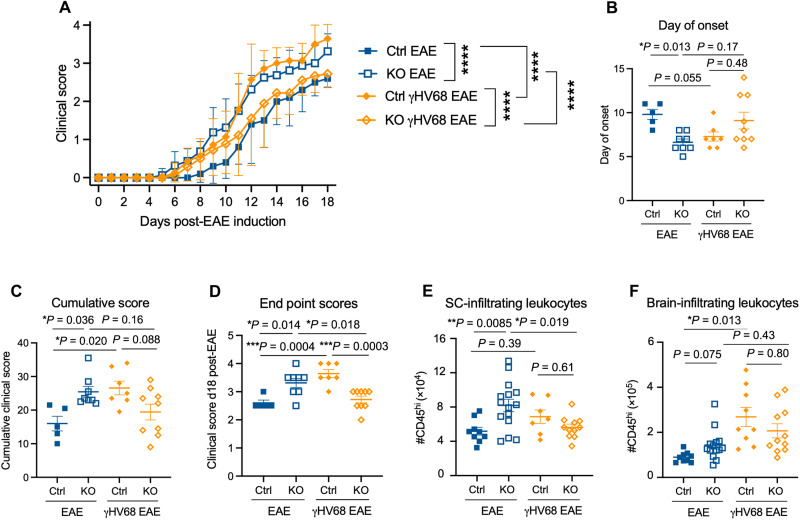
Fig. 4. EAE disease course is altered in ABC KO mice.
Female Tbx21fl/flCd19cre/+ (KO, open symbols) and Tbx21fl/flCd19+/+ (Ctrl, filled symbols) mice were infected with γHV68 or mock-infected for 35 days and then induced for MOG35–55 EAE and clinically monitored for 18 days. (A) EAE clinical scores; n = 5 to 9 per group. (B) Day of clinical symptom onset after induction. (C) Cumulative scores and (D) end point scores at day 18 after EAE induction. (E and F) Number of CD45hi cells in the spinal cord (E) and brain (F). Data were analyzed by (A) two-way ANOVA with multiple comparisons or (B to F) one-way ANOVA with multiple comparisons. Data are pooled across three independent experiments, presented as means ± SD (A) or means ± SEM (B to F); ****P < 0.0001, ***P < 0.001, **P < 0.01, and *P < 0.05.

