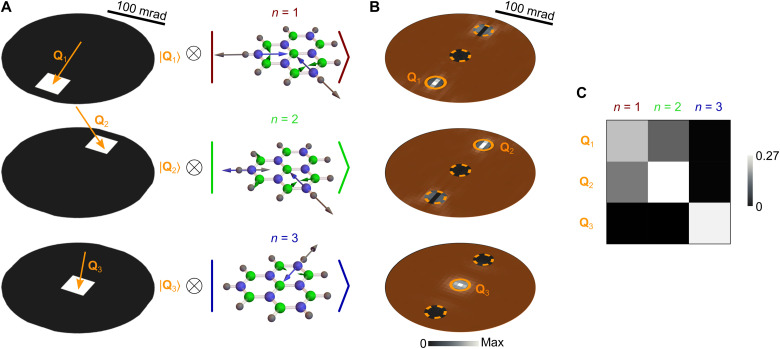
Fig. 4. Entanglement of free electrons and atomic vibrations.
(A) Pursued electron–sample entangled state, consisting of the superposition of selected (by means of three apertures) electron-momentum states within the white pixels in Qf space (left) and correlated triply degenerate 440-meV vibrational modes of an hBN molecule (right). (B) Resulting probability distributions ∣〈Qf, n∣Ψf〉∣2 with n = 1 (top), n = 2 (middle), and n = 3 (bottom) in Qf space. The area outside the apertures (small circles) is colored to emphasize the selected momentum regions of interest. (C) Probability matrix showing the fractional contribution associated with the excitation of each of the three vibrational modes n = 1 to 3 to the energy-filtered electron signal contained within the three selected circular areas around final transverse wave vectors Q1, Q2, and Q3 in (A). The sum of the nine matrix elements is normalized to one. We consider 60 keV electrons, 29 detector pixels, and φi = φf = 100 mrad.

