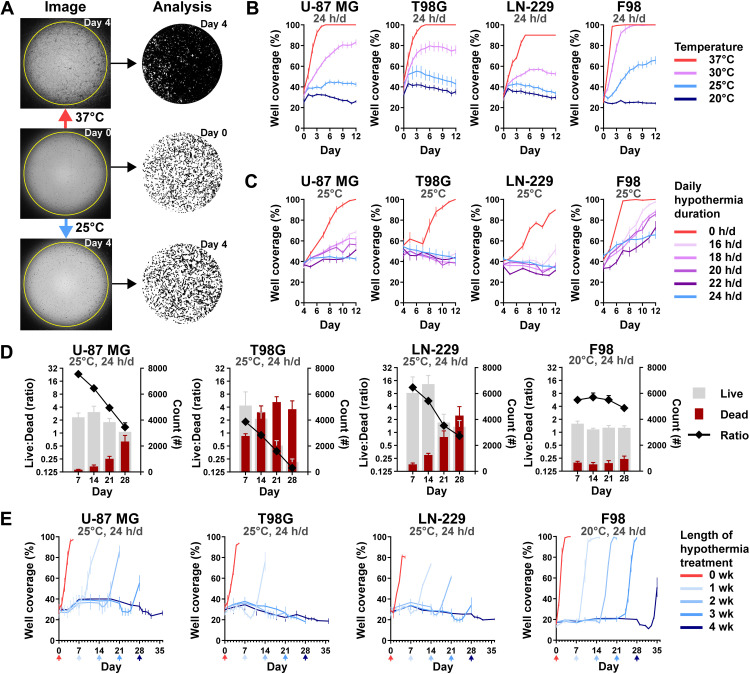
Fig. 1. Effect of continuous and intermittent cytostatic hypothermia on GBM cell lines in vitro.
(A) Tumor coverage analysis; photos (left) and resulting masks (right). Cells were incubated overnight in 96-well plates at 37°C (middle) and then incubated under either normothermia or hypothermia for 4 days (top and bottom). A custom ImageJ macro identified tumor from background and quantified confluence as “well coverage (%).” In the masks, cells are black, and background is white. (B) GBM growth curves (n = 8) via coverage at continuous 37°, 30°, 25°, or 20°C; statistical significance determined via two-way analysis of variance (ANOVA) with Dunnett’s multiple comparisons. (C) GBM growth rates under intermittent 25°C hypothermia after 25°C pretreatment (n = 8); statistical significance determined via two-way ANOVA with Dunnett’s multiple comparisons. (D) Live/Dead assay of GBM lines over time at cytostatic hypothermia temperatures (n = 8). Right y axis: number of living (gray) and dead cells (maroon); left y axis: ratio of Live:Dead cell. (E) Cell viability imaging assay (n = 8). Cells were grown at their cytostatic temperatures for 0, 1, 2, 3, or 4 weeks and then incubated at 37°C for one final week (x-axis arrows indicate the date the color-corresponding plate was transferred). Statistical significance determined via two-way ANOVA with Dunnett’s multiple comparisons reported in Results with remaining statistics in table S1. All graphs show means ± SD.

