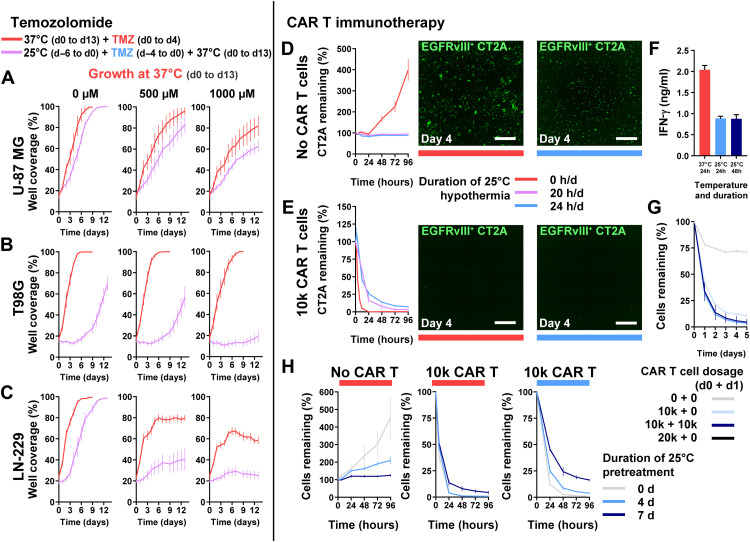
Fig. 3. Use of cytostatic hypothermia with chemotherapy and CAR T immunotherapy.
(A to C) Growth curves of U-87 MG, T98G, and LN-229 at 37°C with or without TMZ (DMSO only or 500 and 1000 μM TMZ) and either after or without hypothermia. Red line represents growth with concomitant TMZ chemotherapy from days 0 to 4 at 37°C and subsequent growth in fresh medium. Purple line represents growth at 37°C in fresh medium after completion of TMZ and 25°C hypothermia treatment (n = 8). Statistical significance determined via two-way ANOVA with Sidak’s post hoc test. (D and E) GFP+EGFRvIII+ CT2A tumor cells remaining after treatment without (D) and with 10,000 CAR T cells (E) under normothermia, or continuous or intermittent hypothermia (20 hours/day) (n = 4). Representative images of remaining tumor cells at day 4 after beginning treatment. White scale bars, 1000 μm. (F) IFN-γ quantification from the medium with EGFRvIII+ CT2A cells and CAR T cells. One-way ANOVA with Dunnett’s post hoc test demonstrated a significant difference (P < 0.0001) between the 37°C and each of the 25°C groups. (G) Remaining CT2A cells with higher or multiple CAR T cell dosage over 2 days under 25°C hypothermia. (H) Remaining CT2A cells after pretreatment with 25°C hypothermia for 0, 4, or 7 days, followed by addition of 0 or 10,000 CAR T cells, and plate moved to either 37°C (left and middle) or 25°C (right). All graphs show means ± SD.

