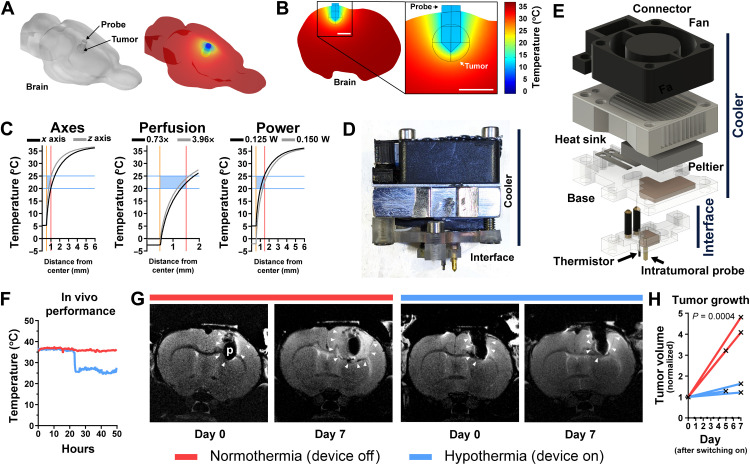
Fig. 4. Finite-element analysis and device testing for cytostatic hypothermia delivery.
(A) Left: 3D model of rat brain with a probe and subcortical spherical tumor. Right: Finite-element simulation of temperature on the brain surface. (B) Slice and magnified inset from finite-element model of rat brain with local hypothermia. (C) Finite-element analysis of hypothermia varying parameters. Center of tumor and probe lie at x = 0. Gold bar indicates surface of gold cooling probe. Red bar indicates surface of tumor. Blue bars and box show cytostatic range of temperature. Left: Extent of cooling of a 1-mm radius tumor from the nearest probe surface in the x axis (black) versus z axis (gray) of a coronal plane. Middle: Varying tumor (1.5-mm radius) perfusion relative to brain perfusion (0.73×, black to 3.96×, gray). Right: Varying heat energy withdrawal on cooling a 1.5-mm radius tumor. (D) Image of thermoelectric cooling device with lower Interface for tissue contact and an upper, removable Cooler. (E) Exploded 3D render of thermoelectric device. (F) In vivo temperature measurement from the thermistor of the Interface, 1.5 mm from the probe. (G) Representative T2-weighted MR images of F98 tumor growth on days 0 and 7 in the brains of Fischer rats. Red bar indicates that device was off (normothermia) between images, and blue bar indicates that device was on (hypothermia). White arrowheads indicate tumor boundaries. p, probe. (H) F98 tumor volume measured via MRI and normalized to day 0 (n = 3). Each line represents one rat. Mixed-effects analysis was conducted to compare the groups.

