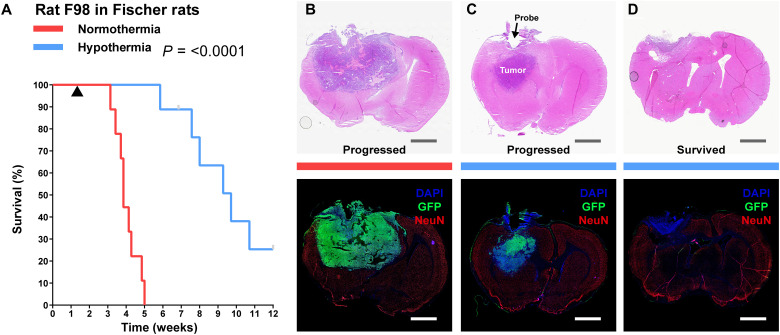
Fig. 5. Delivery of local cytostatic hypothermia in Fischer rats inoculated with F98 GBM.
(A) Kaplan-Meier survival plot of rats with the device switched off (red, n = 9) or switched on to deliver hypothermia (blue, n = 9). Gray bars indicate censored rats. Black triangle indicates the start of hypothermia treatment. Groups were compared with the log-rank Mantel-Cox test. Median survival was calculated for nine rats in the normothermia group and six rats in the hypothermia group. Statistics are for all rats. (B to D) Coronal brain sections stained with hematoxylin and eosin (H&E; top) and immunohistochemical markers, 4′,6-diamidino-2-phenylindole (DAPI), GFP, and NeuN (IHC; bottom) to show extent of tumor. Gray and white scale bars, 2.5 mm. (B) Representative section from a rat in the normothermia group. (C) Representative from a rat in the hypothermia groups in which tumor progressed and rat reached euthanasia criteria. Tumor visible in the z direction from probe (D). Representative section from a rat in the hypothermia group that survived through the study period.

