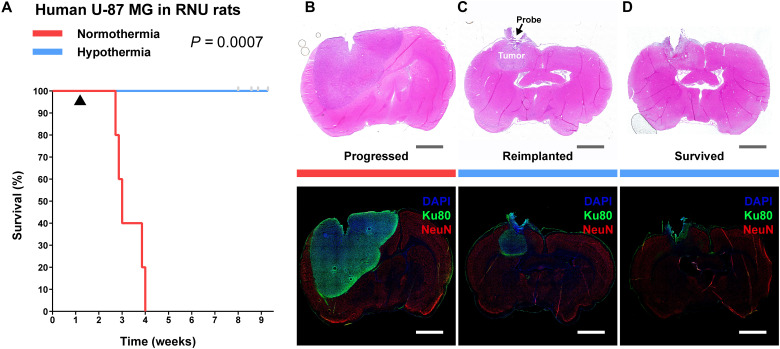
Fig. 6. Delivery of local cytostatic hypothermia in RNU rats inoculated with human U-87 MG.
(A) Kaplan-Meier survival plot of rats with the device switched off (red, n = 5) or switched on to deliver hypothermia (blue, n = 6). Gray bars indicate censored rats. Black triangle indicates start of hypothermia. Groups were compared with the log-rank Mantel-Cox test. (B to D) Coronal brain sections stained with H&E (top) and IHC (bottom) to show extent of tumor. Gray and white scale bars, 2.5 mm. (B) Representative sections from a rat in the normothermia group. (C) Representative sections from a rat in the hypothermia groups that had poor treatment management or multiple device failures and grew a tumor in the z axis (n = 2). (D) Representative sections from a rat in the hypothermia group that did not grow a separate tumor mass (n = 4) and survived the study period.

