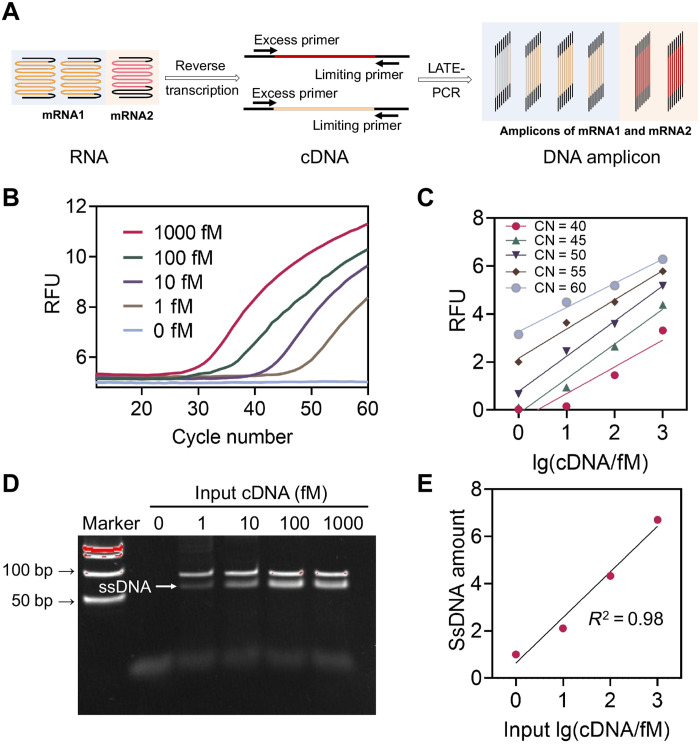
Fig. 2. RNA amplification for molecular computation.
(A) Schematic illustration of mRNA amplification in clinical samples. (B) Detection of LATE-PCR products with different initial concentrations of cDNA (reverse transcription template of mRNA IFIT1, as an example) using a FAM-labeled TaqMan probe. (C) Plot of endpoint PCR fluorescence at different cycle numbers versus initial IFIT1 cDNA concentrations, proving the linear amplification behavior of LATE-PCR with the target concentrations from 1 fM up to 1 pM [cycle number (CN) = 40, R2 = 0.89; CN = 45, R2 = 0.98; CN = 50, R2 = 0.99; CN = 55, R2 = 0.98; CN = 60, R2 = 0.98]. (D) Native PAGE analysis of products after LATE-PCR. (E) Plot of band intensities of the amplified ssDNA products versus initial IFIT1 cDNA concentrations. R2 = 0.98. RFU, relative fluorescence units.

