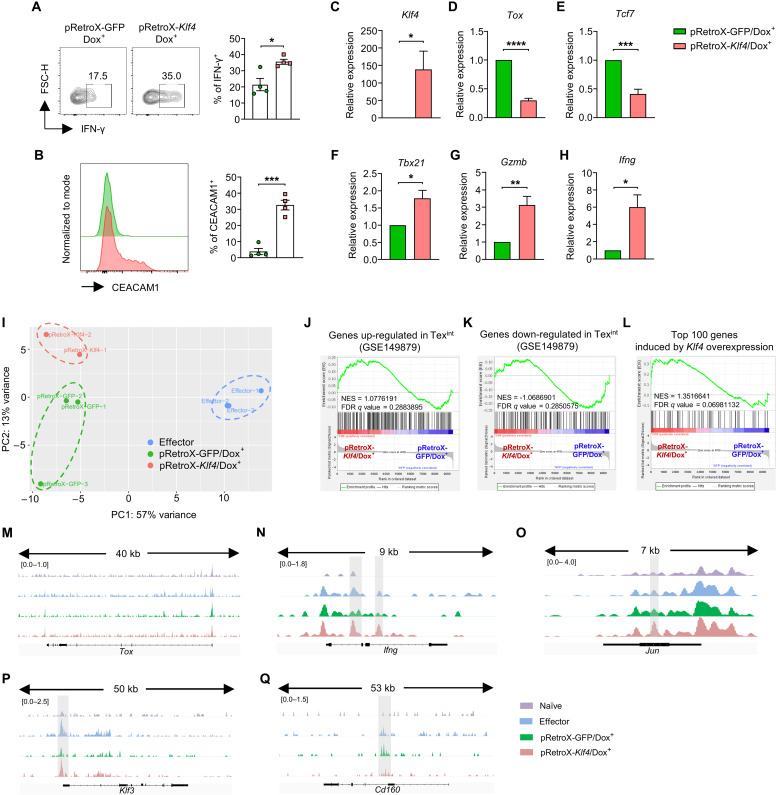
Fig. 6. KLF4 reinvigorates the effector function of exhausted CD8 T cells.
(A to H) OT-I CD8 T cells were transduced with pRetroX-GFP/pRetroX-Klf4 on day 1 during in vitro exhaustion process. Exhausted CD8 T cells were harvested on day 5 and cultured with doxycycline for additional 2 days. GFP+ cells were gated for all analyses. (A) Representative flow cytometry plot and the proportion of IFN-γ+ cells in pRetro-GFP/Dox+ and pRetro-Klf4/Dox+ cells (n = 4 per group). (B) Representative flow cytometry plot of CEACAM1 expression and the proportion of CEACAM1+ cells in pRetro-GFP/Dox+ and pRetro-Klf4/Dox+ cells (n = 4 per group). (C to H) Histogram of relative mRNA expression of (C) Klf4 (n = 4 per group), (D) Tox (n = 4 per group), (E) Tcf7 (n = 4 per group), (F) Tbx21 (n = 3 per group), (G) Gzmb (n = 4 per group), and (H) Ifng (n = 4 per group) in pRetro-GFP/Dox+ and pRetro-Klf4/Dox+ cells. (I to Q) ATAC-seq was performed on naïve, effector, pRetro-GFP/Dox+, and pRetro-Klf4/Dox+ cells. Effector cells were in vitro generated by peptide stimulation for 2 days. (I) Principal components analysis plot of ATAC-seq data from effector CD8 T cells (n = 3), pRetro-GFP/Dox+ (n = 3), and pRetro-Klf4/Dox+ (n = 2) cells. (J to L) GSEA on chromatin accessibility of genes adjacent to peak regions between pRetro-GFP/Dox+ and pRetro-Klf4/Dox+ cells using gene sets of (J) genes up-regulated in Texint, (K) genes down-regulated in Texint, and (L) top 100 genes increased DEGs by Klf4 overexpression (RNA-seq from in vitro exhaustion model). (M to Q) Representative ATAC-seq genome track of (M) Tox, (N) Ifng, (O) Jun, (P) Klf3, (Q) Cd160 in naïve, effector, pRetro-GFP/Dox+, and pRetro-Klf4/Dox+ cells. (A to H) Data are means ± SEM. Statistical analysis was performed using Student’s t test. *P < 0.05; **P < 0.01; ***P < 0.001; ****P < 0.0001.

