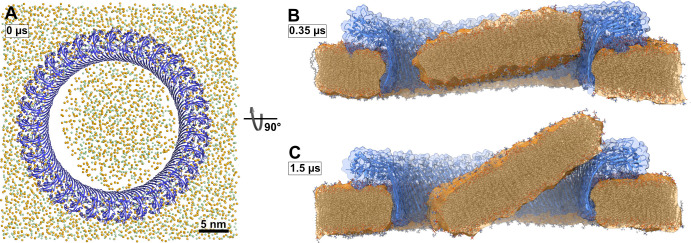
Figure 3. Atomistic MD simulations of GSDMDNT 33-mer rings in pore conformation and filled initially with lipids.
(A) Top view after equilibration. (B,C) Side views after 0.35 µs (B) and after 1.5 µs (C) of MD simulation shown as section through the pore center. The GSDMDNT backbones are shown in blue cartoon representation. In (A), lipid headgroup phosphates and glycerol oxygen atoms are shown as orange and green spheres, respectively. Water, ions, and lipid tails are not shown for clarity. In the sections (B,C), lipid tails are shown in full licorice representation. The outlines of the protein and membrane are represented as transparent surfaces.

