. 2022 Nov 14;11:e81432. doi: 10.7554/eLife.81432

Figure 5. Arc-shaped GSDMDNT oligomers transition into slit or ring-shaped membrane pores.

Top views of GSDMDNT arcs comprising 16 (A) and 27 (B) subunits in pore conformation along MD simulation trajectories (time points indicated) show phospholipid headgroups (orange spheres) and cholesterol oxygens (green spheres) receding from the inserted β-sheet, before the open protein edges approach each other and close into slit-shaped (A) or ring-shaped (B) pores. Water, ions, and lipid tails are not shown for clarity.

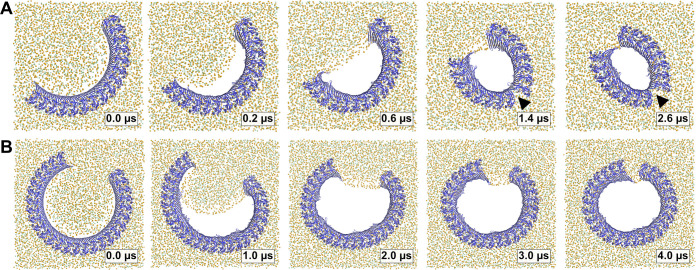
Figure 5.

Figure 5—figure supplement 1. Time lapse images of pore formation from 5–10-meric arcs in the plasma membrane and a 16-meric arc in a pure DOPC membrane.

Figure 5—figure supplement 1.

Top view snapshots of GSDMDNT arcs comprising 5–16 subunits in pore conformation along MD simulation trajectories show lipids (orange spheres) and cholesterol (green spheres) receding from the inserted β-sheet, before the open protein edges come closer to each other. In the case of the 16-mer in a fluid DOPC membrane, the arc closes and forms a ring shaped pore. In all cases, the interfaces between globular domains broke in one to three positions, as indicated with black triangles. Water, ions, and lipid tails are not shown for clarity.
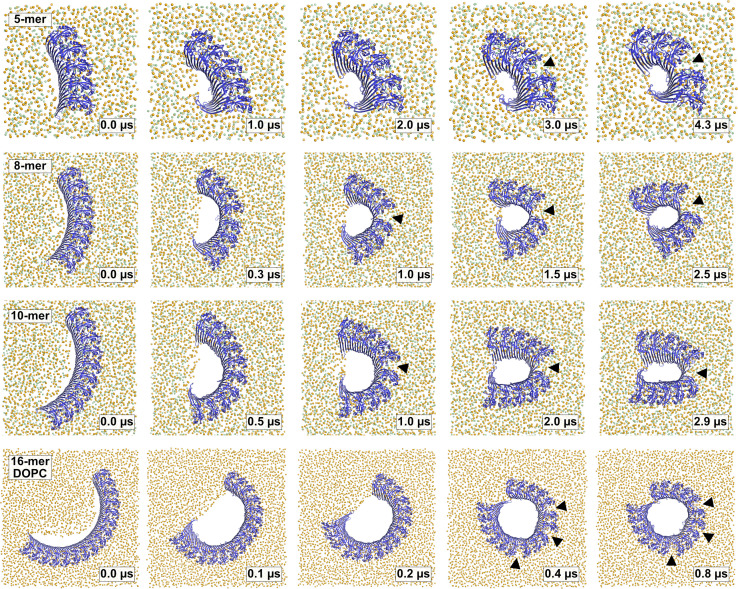
Figure 5—video 1. Formation of a slit-like pore from a membrane inserted 16-meric arc.
Download video file (14.8MB, mp4)
Trajectory from 2.0 µs of simulation, showing the plasma membrane edge receding from the protein and then shortening. This draws the ends of the multimer together, causes breakage of the contacts of two neighboring globular domains, and ultimately the slit-shaped pore of Figure 5A (2.6 µs) develops. Lipid headgroup phosphates are shown as yellow spheres, cholesterol oxygen atoms as light green spheres, and the protein is shown in blue cartoon representation. Water and ions are not shown for clarity.
Figure 5—video 2. Formation of a ring-like pore from a membrane inserted 27-meric arc.
Download video file (23.8MB, mp4)
Trajectory from 4.0 µs of simulation, showing the plasma membrane edge receding from the protein. Lipid efflux first increases the distance between the arc ends, before the open membrane edge then draws the ends together to form the ring-shaped pore of Figure 5B (4.0 µs). Lipid headgroup phosphates are shown as yellow spheres, cholesterol oxygen atoms as light green spheres, and the protein is shown in blue cartoon representation. Water and ions are not shown for clarity.