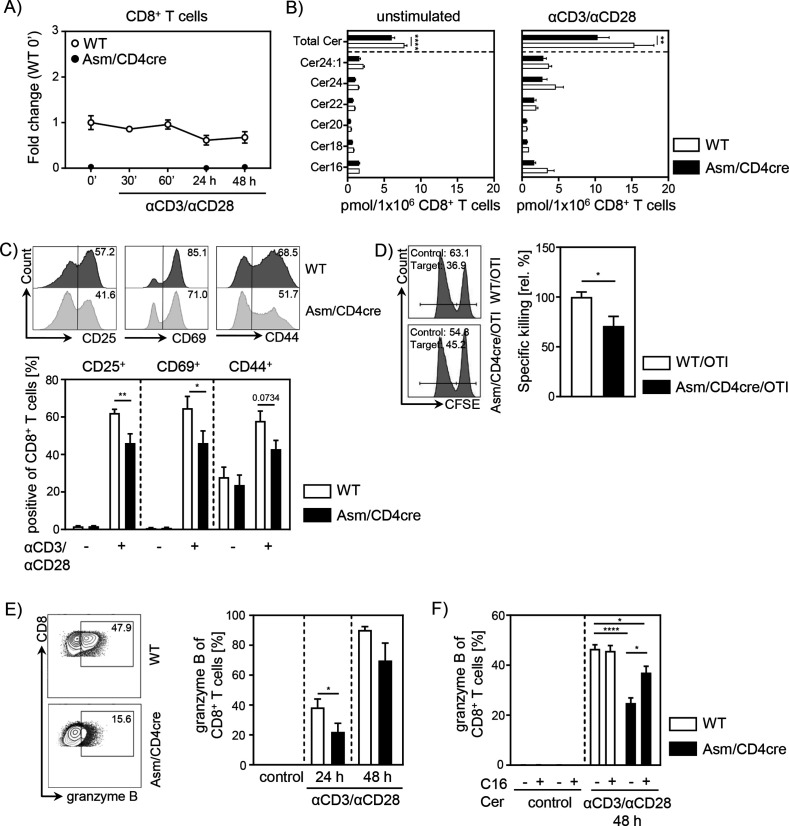
Figure 3. T cell-specific acid sphingomyelinase (Asm) deficiency leads to reduced CD8+ T cell activation in vitro.
Isolated CD8+ T cells from Smpd1fl/fl/Cd4cre/+ mice (Asm/CD4cre) and Smpd1fl/fl/Cd4+/+ littermates (wildtype [WT]) where either left unstimulated or stimulated with anti-CD3 and anti-CD28 for indicated time points. (A) mRNA expression of Asm (Smpd1) following activation was analyzed by RT-qPCR (n=4–8). (B) Ceramide levels of CD8+ T cells were determined by mass spectrometry (n=4). (C) Expression of CD25, CD69, and CD44 was analyzed by flow cytometry (n=6–7). Representative histograms are shown in the upper panel. (D) OVA-specific cytotoxic lymphocytes were generated and incubated with OVA-peptide 257–264 loaded CFSEhigh-labeled target and unloaded CFSElow-labeled control cells. Specific killing was evaluated by frequencies of target and control populations determined by flow cytometry (n=6–7). Representative histograms are shown in the left panel. (E) Frequencies of granzyme B-expressing CD8+ T cells from Asm/CD4cre mice and WT littermates without and (F) in the presence of C16 ceramide were analyzed by flow cytometry (n=4–8). Representative contour plots are shown in the left panel. Results from two to four independent experiments are depicted as mean ± SEM. Statistical analysis was performed by two-way ANOVA with Sidak’s multiple comparisons, Mann-Whitney U-test, or Student’s t-test. (*p<0.05, **p<0.01, ****p<0.0001).


