. 2022 Nov 25;11:e83073. doi: 10.7554/eLife.83073

Figure 6. Acid ceramidase (Ac)-deficient CD8+ T cells have elevated ceramide levels and show increased activation in vitro.

(A) Isolated CD8+ T cells from Asah1fl/fl/Cd4cre/+ mice (Ac/CD4cre) and Asah1fl/fl/Cd4+/+ littermates (wildtype [WT]) where either left unstimulated or stimulated with anti-CD3 and anti-CD28 for indicated time points. mRNA expression of Ac (Asah1) following activation was analyzed by RT-qPCR (n=3–4). (B) Ceramide levels of CD8+ T cells were determined by mass spectrometry (n=4). (C) For T cell receptor signaling analysis, splenocytes from Ac/CD4cre and WT mice were left unstimulated (0’) or stimulated with anti-CD3 and anti-CD28 for 5 (5’) min. Afterward, samples were analyzed for phospho-ZAP70 of gated ZAP70+CD8+ T cells and phospho-PLCγ of gated CD8+ T cells by flow cytometry (n=4). Representative dot plots and fluorescence minus one (FMOs) for phospho-ZAP70 are shown in the left panel. (D) Western blot analysis of phospho-ZAP70 expression of CD8+ T cells from Ac/CD4cre and WT mice after 5 min of stimulation with anti-CD3 and anti-CD28 (n=3). (E) CD8+ T cells were left untreated as control or stimulated for 24 or 48 hr and analyzed for granzyme B expression by flow cytometry (n=5–8). Representative contour plots are shown in the left panel. (F) Specific killing of antigen-specific cytotoxic lymphocytes from Ac/CD4cre/OTI mice and WT controls was assessed (n=8–9). Representative histograms are shown in the left panel. Data are depicted as mean ± SEM. Statistical analysis was performed by two-way ANOVA with Sidak’s multiple comparisons, Mann-Whitney U-test, or Student’s t-test. (*p<0.05, **p<0.01, ****p<0.0001).

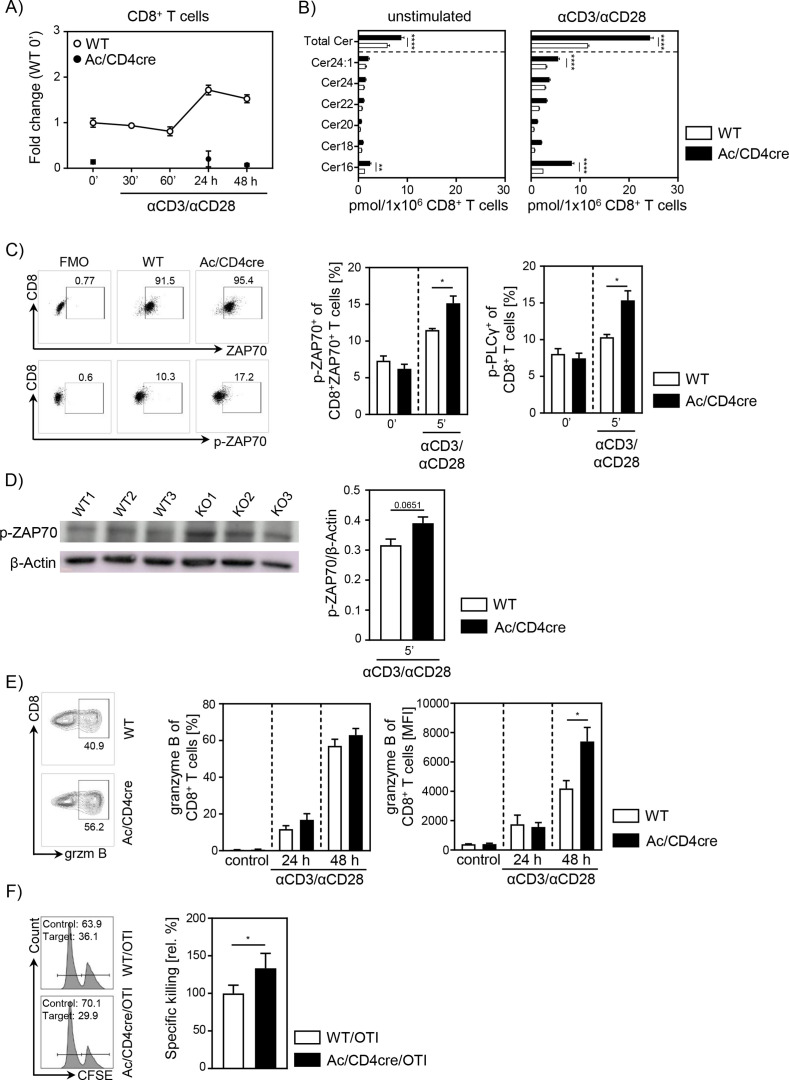
Figure 6—source data 1. Ac-deficient CD8+ T cells have elevated ceramide levels and show increased activation in vitro.

Figure 6.

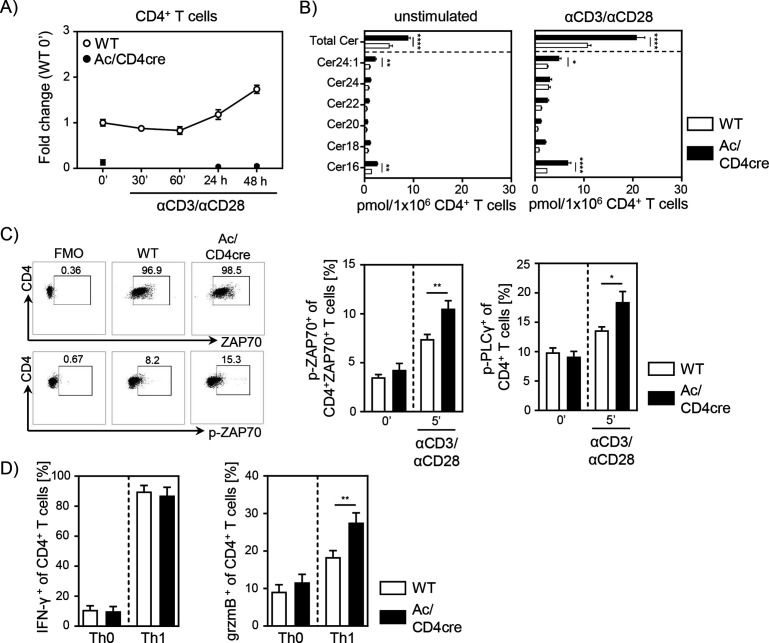
Figure 6—figure supplement 1. In vitro characterization of acid ceramidase (Ac)-deficient CD4+ T cells.

Figure 6—figure supplement 1.

(A) Isolated CD4+ T cells from Ac/CD4cre and wildtype (WT) mice were either left unstimulated or stimulated with anti-CD3 and anti-CD28 antibodies for indicated time points. mRNA expression of Ac (Asah1) was analyzed by RT-qPCR (n=3–4). (B) Ceramide levels of unstimulated and anti-CD3/anti-CD28 stimulated (24 hr) CD4+ T cells from Ac/CD4cre and WT mice were determined by mass spectrometry (n=4). (C) For T cell receptor signaling analysis, splenocytes from Ac/CD4cre and WT mice were left unstimulated (0‘) or stimulated with anti-CD3 and anti-CD28 antibodies for 5 (5’) min. Afterward, samples were analyzed for phospho-ZAP70 of gated ZAP70+CD4+ T cells and phospho-PLCγ of gated CD4+ T cells by flow cytometry (n=4–7). Representative dot plots and FMOs are shown in the left panel. (D) In order to differentiate naïve CD4+CD25 T cells from Acflox/flox/CD4cre and WT mice into Th1 cells, isolated cells were cultured in the presence of anti-CD3, anti-CD28, anti-IL-4, and IL-12 (Th1), or only stimulated with anti-CD3 and anti-CD28 antibodies (Th0). After 6 days, cells were analyzed for IFN-γ and granzyme B expression by flow cytometry (n=9). Results from two to three independent experiments are depicted as mean ± SEM. Statistical analysis was performed by two-way ANOVA with Sidak’s multiple comparisons or Student’s t-test. (*p<0.05, **p<0.01, ****p<0.0001).