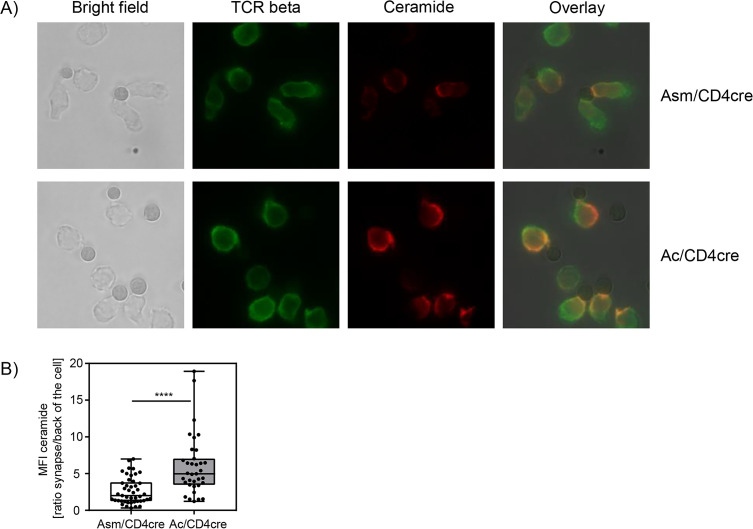
Figure 7. Synaptic ceramide is elevated in acid ceramidase (Ac)-deficient T cells compared to acid sphingomyelinase (Asm)-deficient T cells.
(A) CD8+ T cells were isolated from Asm/CD4cre or Ac/CD4cre mice and stimulated with CD3/CD28 MACSiBead particles for 2 hr and stained for ceramide (red) and T cell receptor beta (green). Cells were visualized using a Biorevo BZ-9000 fluorescence microscope. (B) The ceramide signal was quantified in the synapse and in the back of cell, and the ratio of the signals was calculated (n=35–45). Data are depicted as boxplot with min/max whiskers. Statistical analysis was performed by Student’s t-test. (****p<0.0001).

