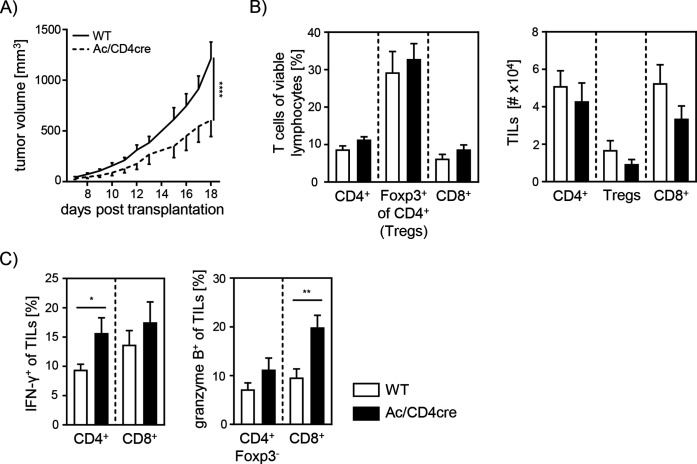
Figure 8. Elevated anti-tumor immune response in T cell-specific acid ceramidase (Ac)-deficient mice.
(A) B16-F1 melanoma cells were transplanted into Ac/CD4cre mice and wildtype (WT) littermates. Tumor volume was monitored once tumors have been established (n=8–10). (B) Percentages of CD4+ T cells, Foxp3+ Tregs, and CD8+ T cells were determined by flow cytometry, and absolute cell numbers were calculated. (C) Frequencies of IFN-γ+ and granzyme B+ tumor-infiltrating lymphocytes (TILs) were determined by flow cytometry. Results from two independent experiments are depicted as mean ± SEM. Statistical analysis was performed by two-way ANOVA with Sidak’s multiple comparisons or Student’s t-test. (*p<0.05, **p<0.01, ****p<0.0001).

