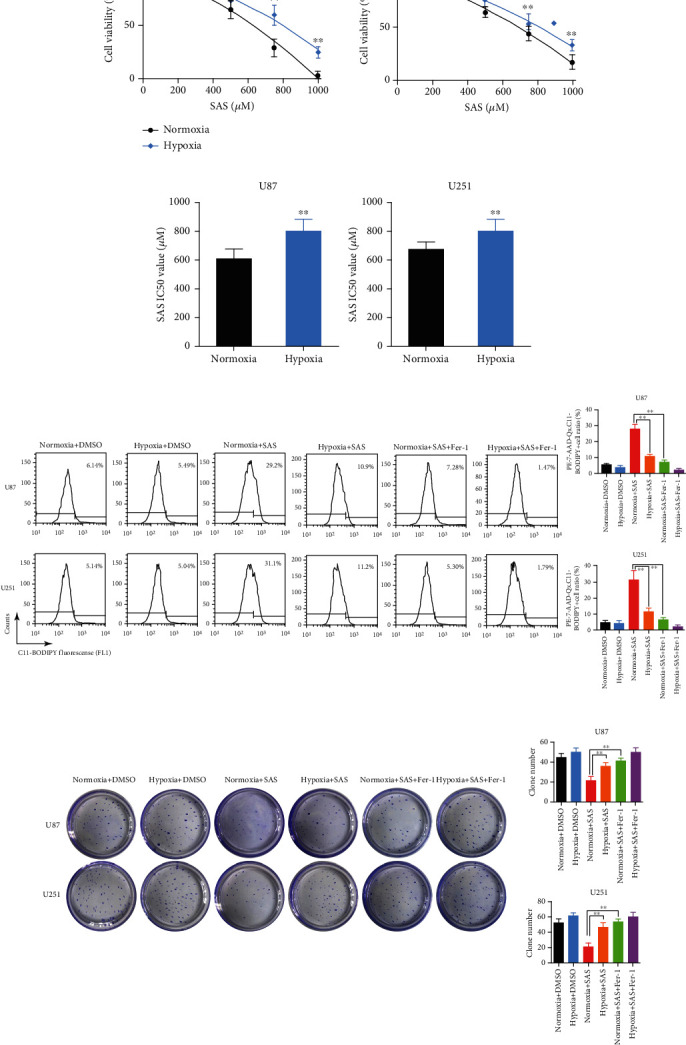
Figure 1.

Hypoxia enhanced resistance of glioma cells to SAS-induced ferroptosis. (a) Cell viability curves at different concentrations of SAS for 24 h. Glioma cells under hypoxic environment became less sensitive to SAS. (b) Half-maximal inhibitory concentrations (IC50) were calculated in each group. Hypoxic cells had an obvious higher IC50 to SAS. (c) Lipid peroxidation assessed in the U87 and U251 cells after exposure to hypoxia, SAS, and Fer-1 by flow cytometry using C11-BODIPY. (d) Clone formation assay of cancer cells in the absence or presence of SAS or Fer-1 under normoxia or hypoxia. The bar graph showed mean ± SD of 3 independent experiments. ∗P < 0.05 and ∗∗P < 0.01.
