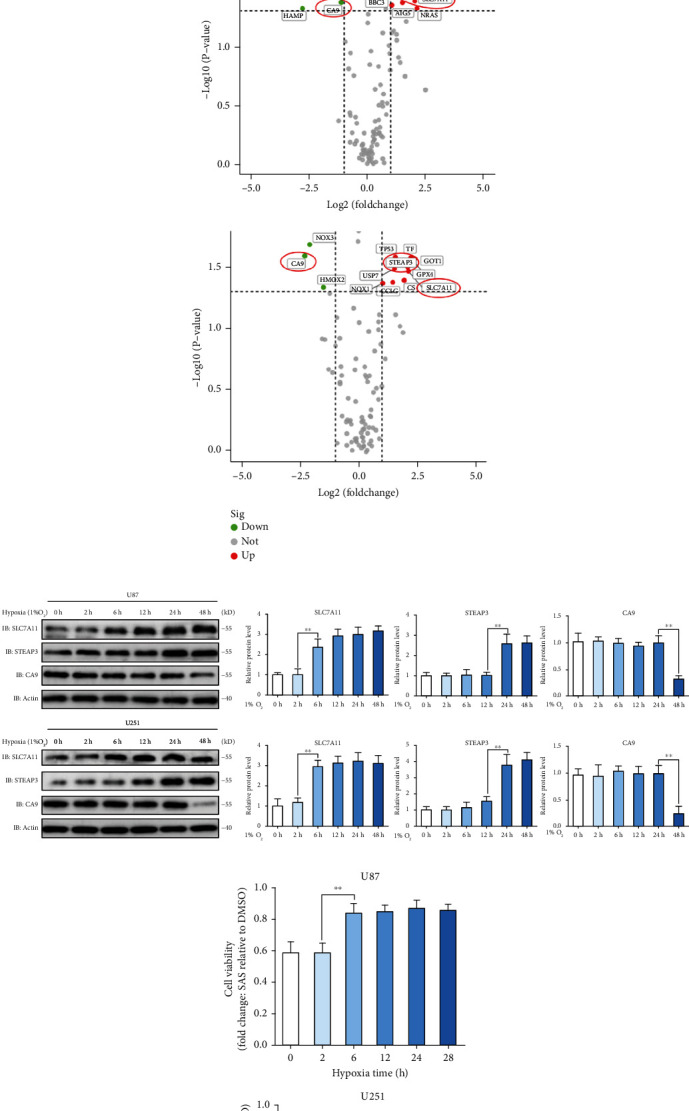
Figure 2.

SLC7A11 was screened out as a potential effector molecule of hypoxia. (a) Ferroptosis-related qPCR array of normoxia and hypoxia identified several differentially expressed genes in the U87 and U251 cells. (b) The volcano map of differentially expressed genes depicted by difference degree and P value. SLC7A11, STEAP3, and CA9 were picked out. (c) Protein expression level of SLC7A11, STEAP3, and CA9 over a series of time points measured by western blot. SLC7A11 protein expression increased significantly at the sixth hour under hypoxia. (d) SAS resistance was measured by the ratio (cells exposed to SAS (500 μM, 24 h)/cells exposed to DMSO). Glioma cells under hypoxic environment for at least 6 hours showed stronger SAS resistance. (e) Cell immunofluorescence showed that the fluorescence intensity of SLC7A11 protein in cells incubated under hypoxia for 6 hours was significantly higher than that in cells incubated under normoxia. The bar graph showed mean ± SD of 3 independent experiments. ∗P < 0.05 and ∗∗P < 0.01.
