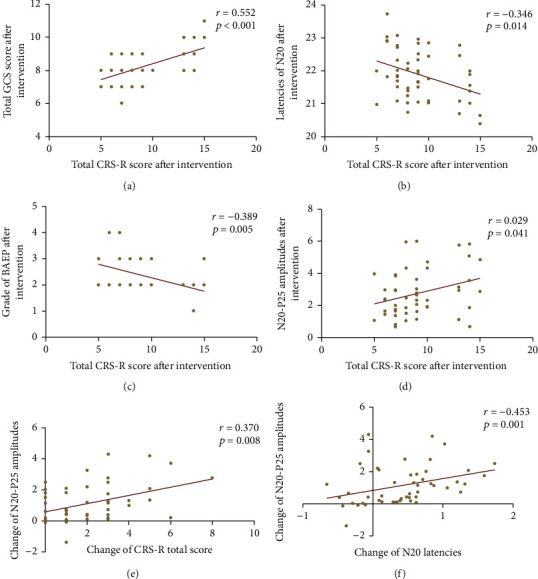
Figure 5.

Correlation between the scores of clinical scales and the parameters of electrophysiological assessments after intervention. (a) The total GCS score was significantly related to the total CRS-R score. (b) The N20 latency exhibited a significant negative correlation with the total CRS-R score. (c) The BAEP grade was related to the total CRS-R score. (d) The total CRS-R score was related to the N20-P25 amplitude. The change of N20-P25 amplitude was related to (e) the change of total CRS-R score and (f) N20 latency.
