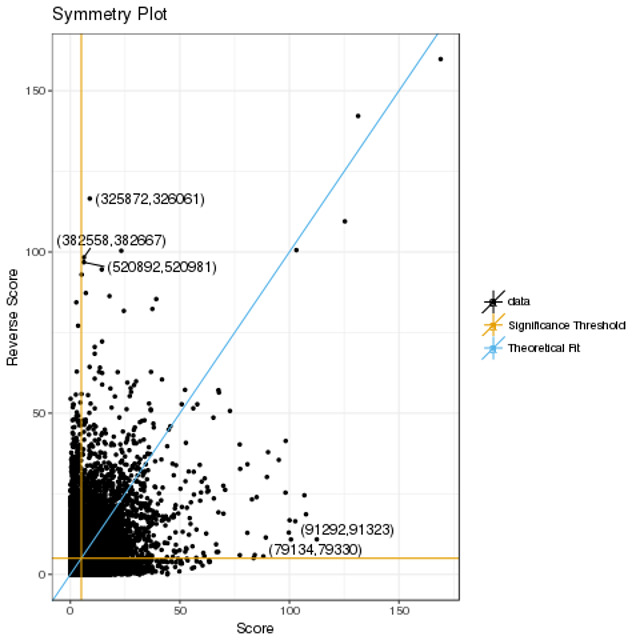
Figure 2. Plots of the score statistics for bait-bait pairs in ACD4.

The five pairs with the largest deviation, (Score – Reverse Score) 2, are labelled with their IDs from the rmap file. The significance threshold of 5 is indicated by orange lines, with the blue line corresponding to the theoretical fit of Score=Reverse Score.
