
Figure 5.
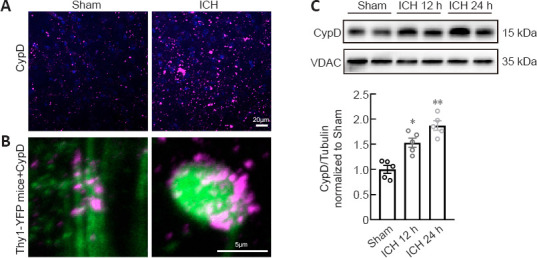
CypD upregulation in degenerated axons.
(A) Representative immunofluorescence micrograph of CypD (magenta) around the hematoma in each group. The expression of CypD was much higher in the ICH group compared with that in the Sham group. (B) Representative immunofluorescence micrograph of CypD (magenta) in normal and degenerated axons (green) around the hematomas in Thy1-YFP mice in each group. The expression of CypD was much higher in the degenerated axons in the ICH group compared with that in the normal axons in the Sham group. Scale bar: 20 μm in A, 5 μm in B. (C) Representative western blot and quantification of CypD in tissues around the hematoma 12 and 24 hours after ICH. VDAC is the internal reference. Data are shown as the mean ± SEM (n = 5 animals for each group). *P < 0.05, **P < 0.01, vs. Sham group (one-way analysis of variance followed by Tukey’s post hoc test). CypD: Cyclophilin D; ICH: intracerebral hemorrhage; VDAC: voltage-dependent anion channel.